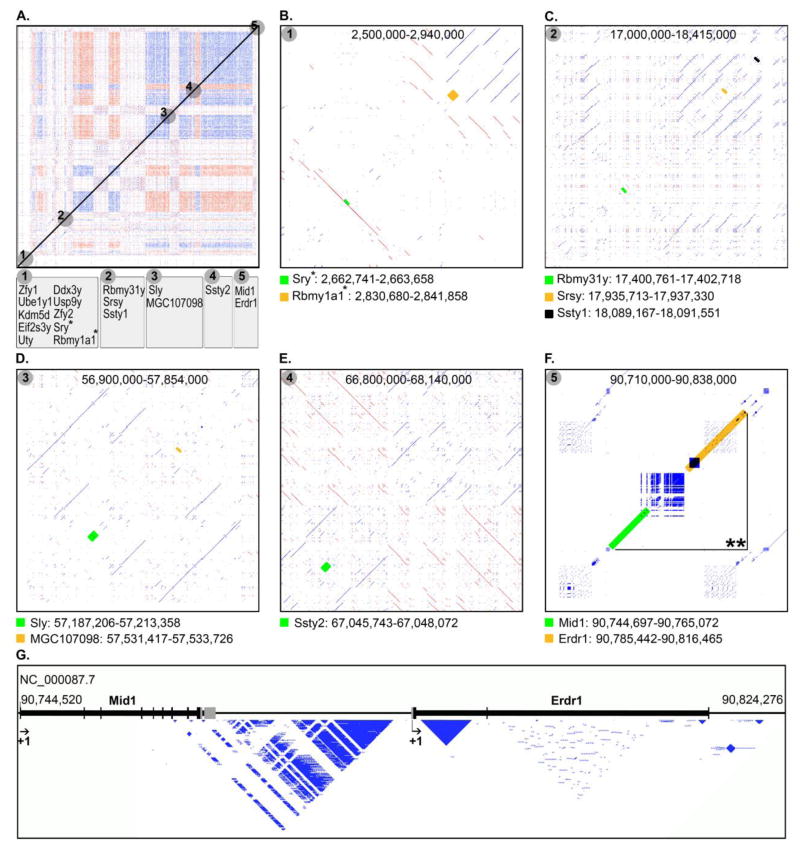
Figure 3. Map of the functional genes of MMUY in conjunction with the RE and RE array profiles of intragenic and neighboring areas.
A. Five different regions (gray circles: region-1 through region-5), which harbor a total of 18 functional genes (annotated in the NCBI database), were mapped on the dot-matrix plot of REs and RE arrays of MMUY. Each region contains one to ten annotated genes. *Indicates two gene loci of region-1 which are subjected to further structural analyses in panel B. B–F. For each of the selected gene loci indicated in panel A by numbered grey circles, a high-resolution dot-matrix plot data is drawn to examine occurrences of REs and RE arrays in the intragenic and surrounding areas. Each gene locus, which is listed with the corresponding dot-matrix plot, is indicated with a green, yellow, or black box. **Indicates the section within region-5 (panel F) which is subjected to a detailed structural analysis in panel G. G. The exon-intron structures of Mid1 and Erd1 loci (the region labeled with “**” in panel F) of region-5 were aligned with the REs and RE arrays embedded in the area. Each gene locus is represented with a black horizontal line and its exons are indicated with vertical lines/boxes. The vertical grey lines/boxes identify untranslated regions of the respective exons.

