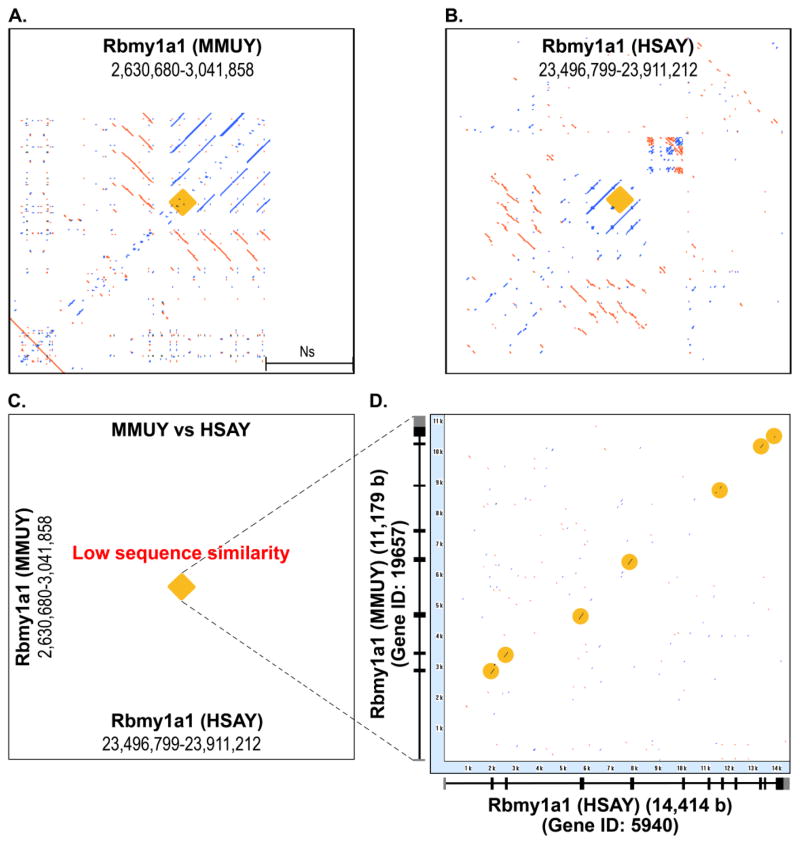
Figure 4. Orthologous Rbmy1a1 gene loci of MMUY and HSAY which are surrounded by a similar RE array.
RE arrays formed in the regions surrounding the orthologous Rbmy1a1 gene loci (gene region+/− 200 Kb) on MMUY and HSAY were identified using the REMiner-II program. Both regions shared a similar RE array configuration (MMUY [A] and HASY [B]); however, there was no significant nucleotide sequence similarity (C). In panel C, gene loci are identified with a brown square. The exon structures of Rbmy1a1 genes on HSAY and MMUY are presented on X-axis and Y-axis of the dot-matrix alignment plot of the two orthologous loci, respectively (D). The Rbmy1a1 gene sequences from MMUY and HSAY aligned primarily on their exon sequences which are indicated with some lines/dots (brown circles).

