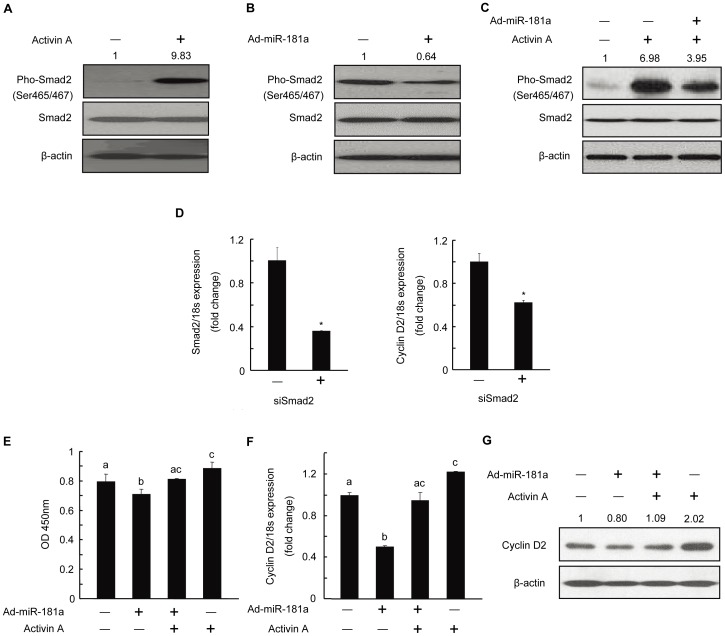
Figure 5. Inactivation of the activin signaling pathway by miR-181a.
Western blot analysis of the levels of Smad2 and phosphorylated Smad2 (Ser465/467) in mouse granulosa cells (mGC) treated with 50 ng/ml activin A (A) or infected with 50 MOI Ad-miR-181a (B) for 24 h. (C) mGC was infected with 50 MOI Ad-miR-181a for 24 h, and cells were then treated with 50 ng/ml activin A for another 24 h. The protein level of Smad2 and phosphorylated Smad2 were measured by Western blotting. (D) qRT-PCR analysis of Smad2 and cyclin D2 expression in mGC transfected with 50 nM siRNA duplexes targeting mouse Smad2 (siSmad2) or siRNA negative control for 48 h. *p<0.05, compared with controls. (E, F, and G) mGC was infected with 50 MOI Ad-miR-181a or Ad-LacZ for 24 h, and cells were then treated with 50 ng/ml activin A for another 24 h. (E) mGC proliferation was examined by CCK-8. Cyclin D2 mRNA (F) and protein (G) levels were measured by qRT-PCR and Western blotting. Relative protein levels of phosphorylated Smad2 and cyclin D2 were measured by densitometry using Quantity One Software and normalized to β-actin, the control group; the ratios were presented above the Western blot bands. Bars labeled with different letters indicate statistically significant differences (p<0.05).

