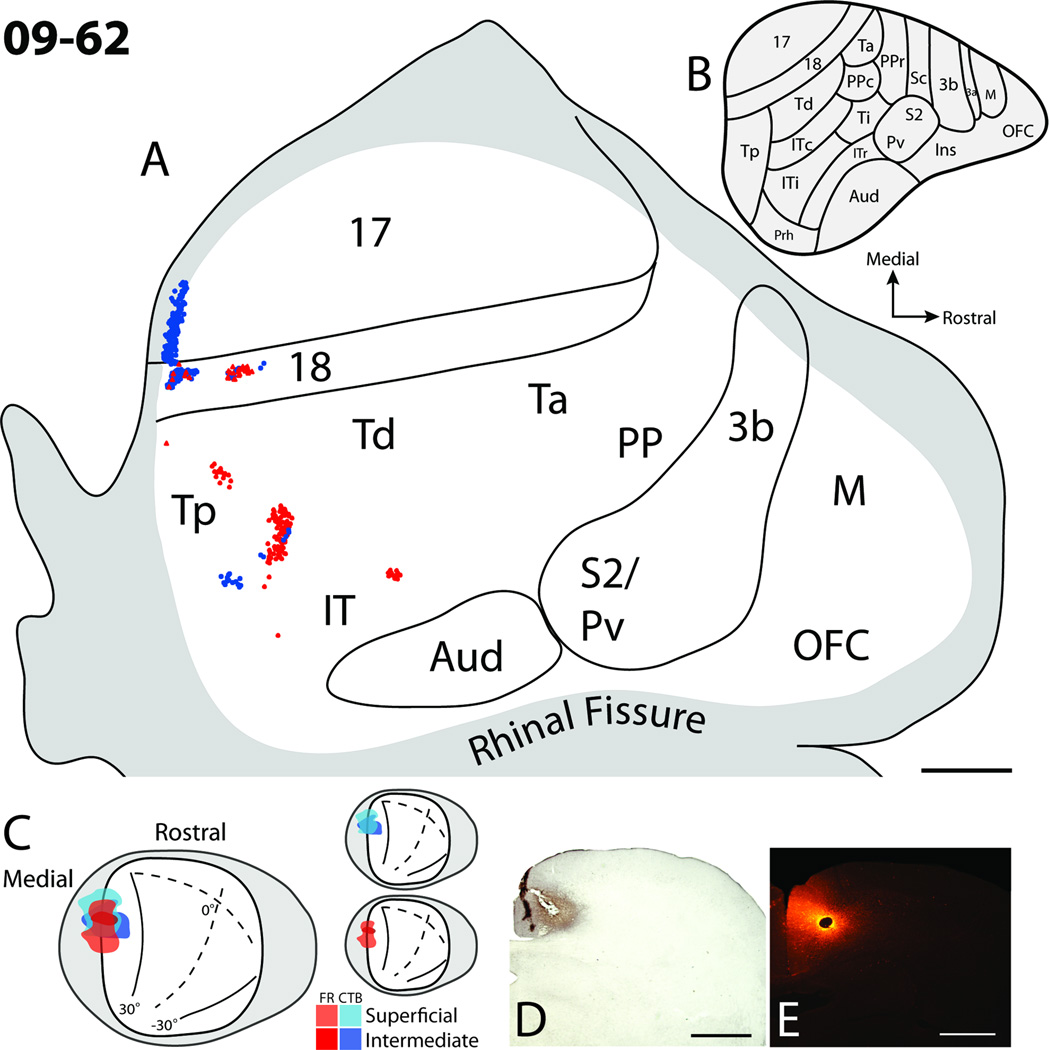
Figure 4.
Cortical projections to the superficial and intermediate layers of the superior colliculus in case 09–62. A. The distribution of retrogradely labeled cells within the flattened cortex after fluoro-ruby (FR) and cholera toxin subunit B (CTB) injections into the superior colliculus. Solid lines represent borders determined using myelin stained sections, and the grey shaded region represents cortex that was either along the medial or ventral surfaces of the brain. Red dots represent the locations of retrogradely labeled FR cell bodies, while blue dots represent the locations of retrogradely labeled CTB cell bodies. B. Proposed cortical areas for tree shrews (Wong and Kaas, 2009). C. Dorsal view of the superior colliculus showing the locations of injection sites. Red hues represent the location of the FR injection site, while blue hues represent the location of the CTB injection site. Darker hues indicate the location of injection sites deeper within the superior colliculus. C. Photomicrographs of the CTB (D) and FR (E) injection sites in coronal sections through the superior colliculus. Scale bar for A is 2mm, and D and E is 1mm.

