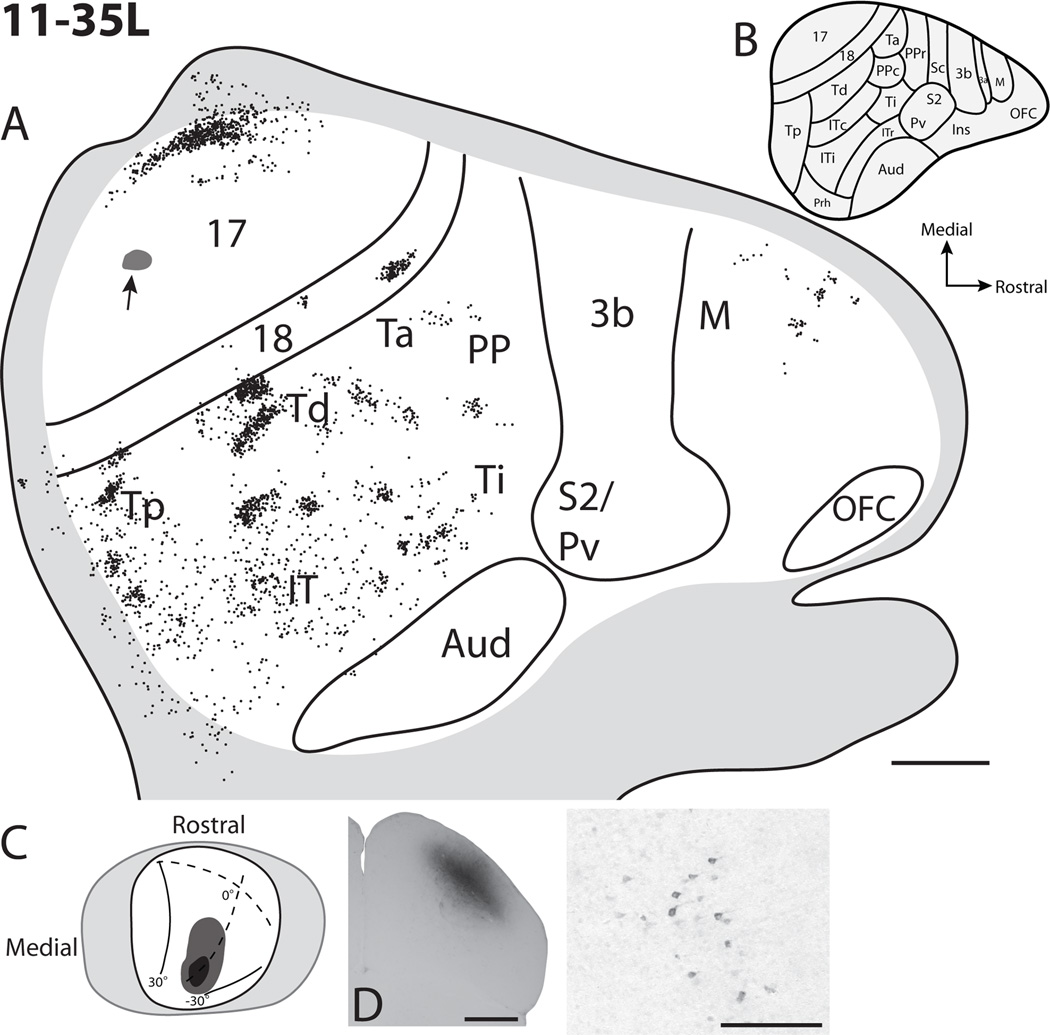
Figure 7.
Cortical projections to the superficial, intermediate, and deep layers of the superior colliculus in case 11-35L. A. Reconstruction of the distribution of labeled cells within flattened cortex of the left hemisphere. The cortex has been flipped to appear as the right hemisphere ease comparisons of cortical label with other cases. The small black area with an arrow in area 17 represents the location of the penetration track used for tracer placement. B. Cortical organization map adapted from Wong and Kaas 2009. C. Dorsal view of the superior colliculus with the visuotopic map of Lane et al. (1971) superimposed. In this case the darker grey represents the core of the injection site, while the light grey represents the tracer spread. D. Photomicrograph of a portion of the CTB injection site in a coronal view of the superior colliculus. E. An example of CTB labeled neurons in cortex. Scale bar for A is 2mm, D is 1mm, and E is 0.5mm.

