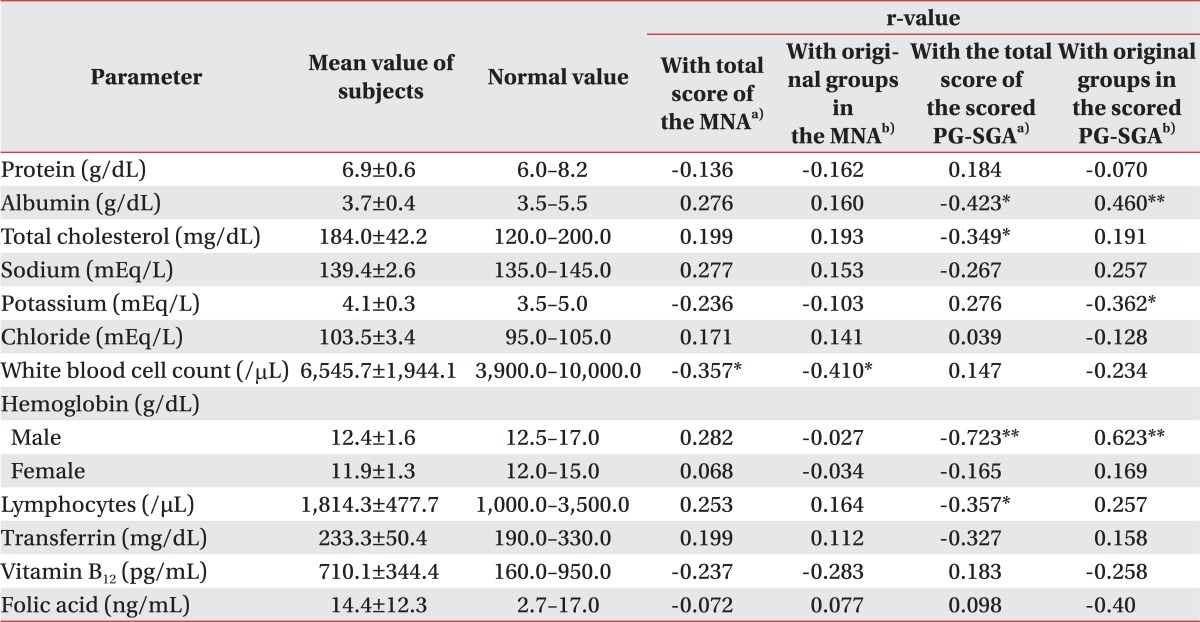
Table 2.
Mean values of subjects and correlation analysis in laboratory parameters

Values are presented as mean±standard deviation or range.
MNA, Mini Nutritional Assessment; PG-SGA, Patient-Generated Subjective Global Assessment.
a)Pearson correlation analysis, b)Spearman correlation analysis, *p<0.05, **p<0.01.
