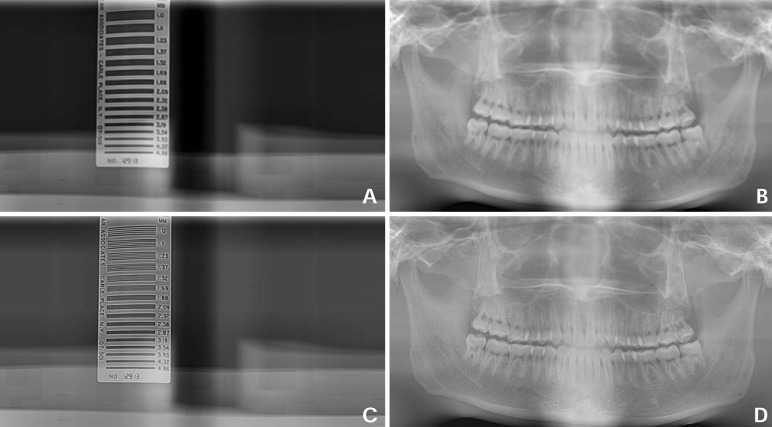
Fig. 6.
The post-processed test phantom radiographs and corresponding post-processed real skull phantom radiographs, respectively. A. The post-processed image of the test phantom in premolar region showing a 1.11 line-pair value (1.11 LP/mm). B. The post-processed image of the real skull phantom under the same parameter settings for "A" image post-processing. C. The post-processed image of the test phantom in the premolar region showing a 2.87 line-pair value (2.87 LP/mm). D. The post-processed image of the real skull phantom under the same parameter settings for "C" image post-processing.

