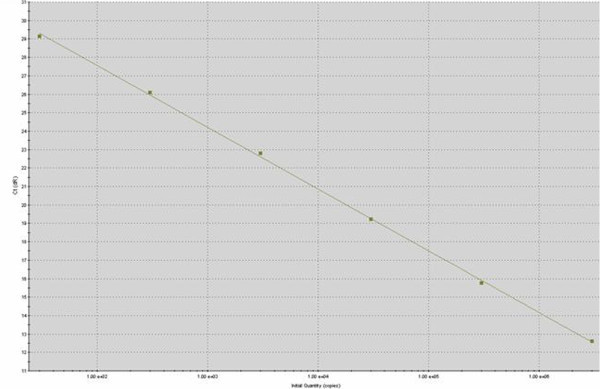
Figure 4.

Standard curve for qPCR assay of MAP IS900gene quantification generated by plotting the known DNA concentrations of standard DNA template (3x10⁷copies) in serial ten-fold dilutions (10-1– 10-6) against the corresponding threshold cycles (Ct values) of the amplification plots with MxProTMQPCR software.
