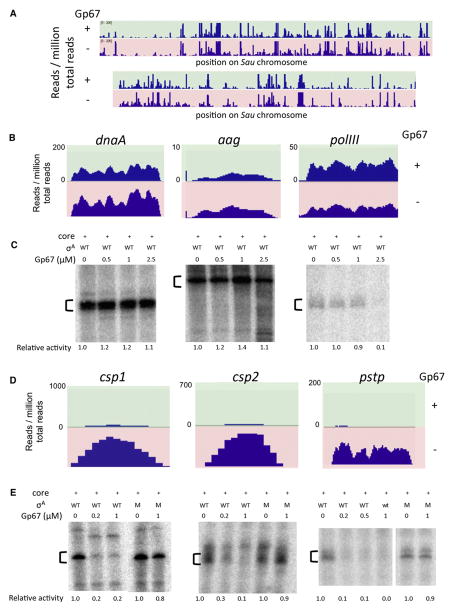
Figure 3. RNA-seq Reveals Promoters that Are Sensitive to gp67 Inhibition In Vivo.
(A) Gp67 production in Sau RN4220 cells does not significantly inhibit RNA levels from ~91% of promoters. RNAs were sequenced directly and visualized with the Integrated Genomics Viewer. The position on the genome is shown on the horizontal axis, and the number of RNA reads per million total reads is shown on the vertical axis. Upper panel (green) represents RNA-seq data from pRMC2-gp67 cells; the lower panel (red) represents RNA-seq data from control pRMC2 cells.
(B) Gp67 production does not inhibit transcription from selected DNA replication promoters in vivo. RNA-seq data were visualized as above from the dnaA, aag, and polIII loci.

