
Figure 5. Structural Model of the gp67/RNAP Holoenzyme/Open Promoter Complex.
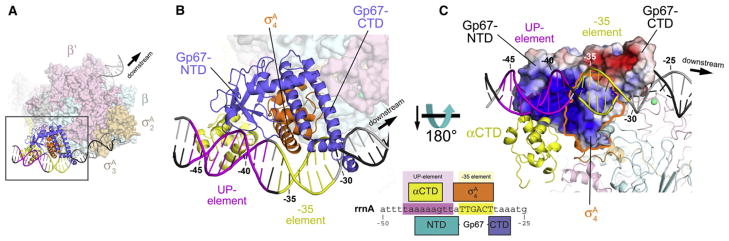
(A) Overall view. The core RNAP is shown as a molecular surface (β′, pale pink; β, pale cyan). The σA subunit is shown as a molecular surface (σA2 and σA 3, pale orange) or a ribbon (σA4, orange). Gp67 is shown as a blue ribbon. One αCTD is shown (yellow ribbon) bound to the proximal UP-element subsite, modeled as described in Jain et al. (2005). The DNA is shown as a phosphate-backbone worm, with the promoter –35 element in yellow and the proximal UP-element subsite (Estrem et al., 1998, 1999) in magenta. The boxed region is magnified in (B).
(B) Magnified view of the –35-element/proximal UP-element region. Shown as in (A). The green sphere denotes a Zn2+ ion. The DNA is numbered with respect to the Sau rrnA promoter start site (see Figure 6A). The schematic at the lower right shows the –35-element/UP-element region of the Sau rrnA promoter. The regions of close protein/DNA interaction for σA4 (orange), gp67 (blue), and αCTD (yellow) are denoted by the span of the boxes.
(C) View toward the gp67/σA4 DNA interaction surface. The RNAP is shown in ribbon format. The molecular surface of the gp67/σA4 complex is colored according to the electrostatic surface distribution (red, –5 kT; white, neutral; blue, +5 kT). The region corresponding to σA4 is outlined in orange.
See also Figure S4 and Tables S1 and S2.