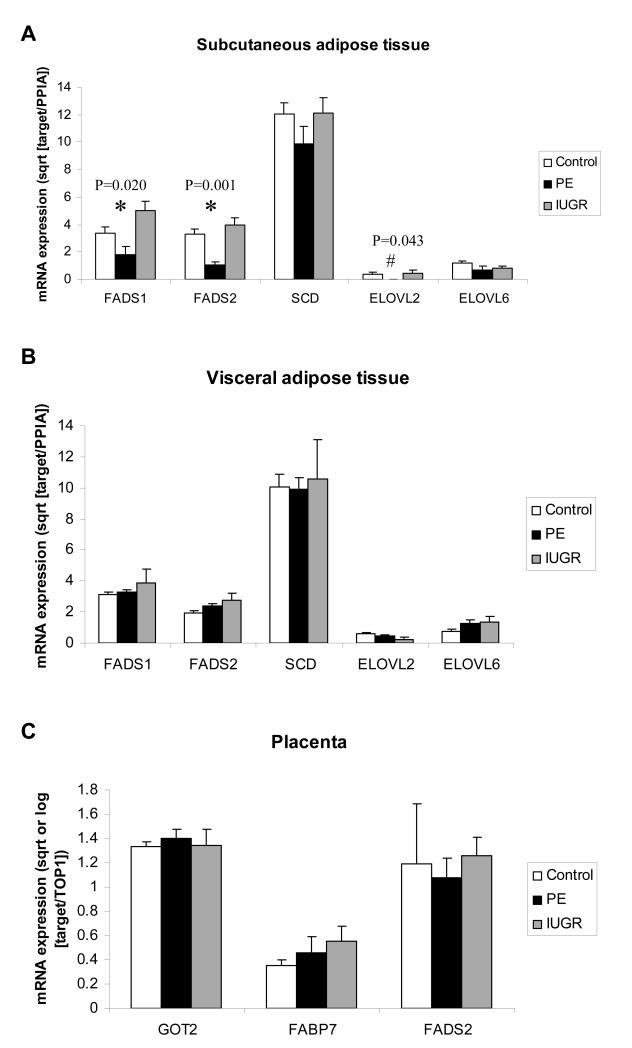
Figure 2.
A. Maternal subcutaneous adipose tissue gene expression in control (n=50), preeclampsia (PE) (n=12) and intrauterine growth restriction (IUGR) (n=13), B. maternal visceral adipose tissue gene expression in control (n=25), PE (n=12) and IUGR (n=5), C. placental gene expression in control (n=57), PE (n=17) and IUGR (n=11) pregnancy relative to control gene (PPIA for adipose tissue and TOP1 for placenta). Means (standard error), of transformed (log [GOT2 and FADS2] or square root) target gene expression relative to control gene expression values, are presented. * significant difference among groups on ANOVA; # significant difference among groups on Kruskal-Wallis test.

