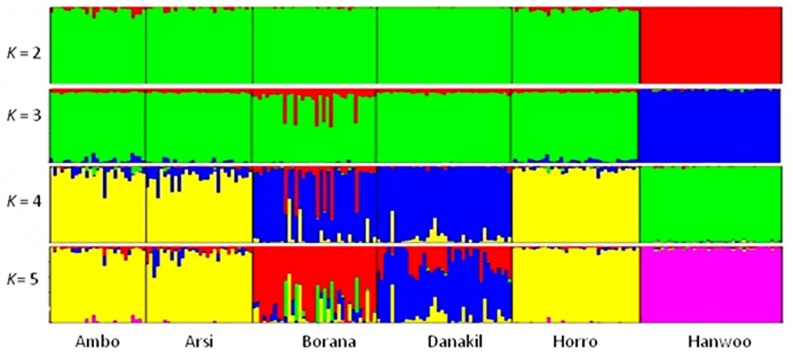
FIGURE 4.
Summary of plots of estimate of Q for K = 5 in six cattle populations. Each individual is represented by a single vertical divided in to K colored segments, where K is the number of cluster assumed with the length proportional to each of the K inferred cluster. Black color separated the populations indicated below the figure.

