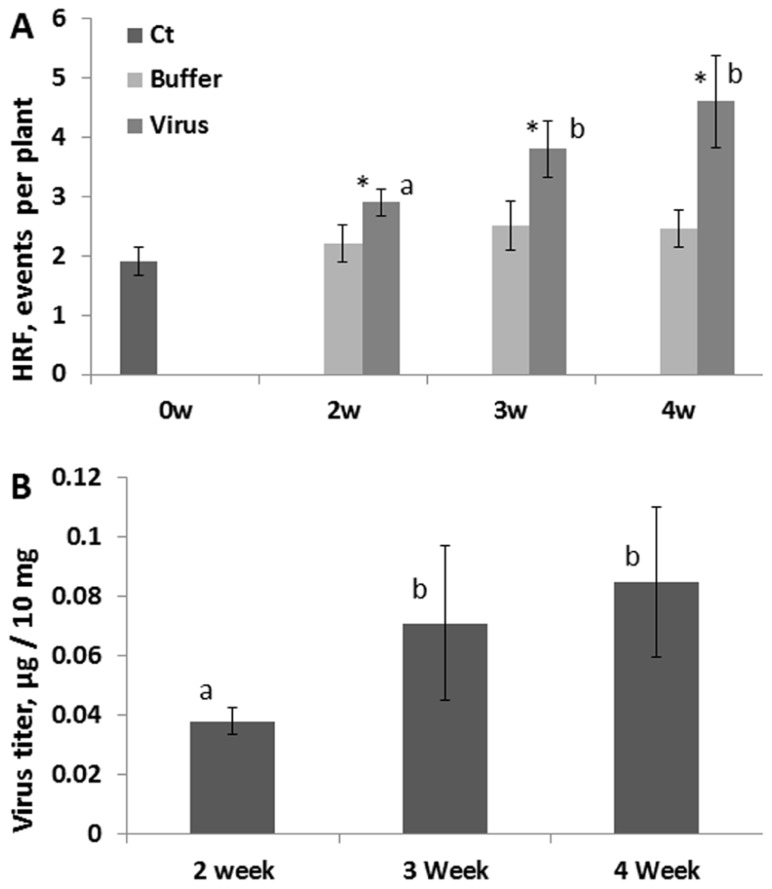
FIGURE 5.
HRF and viral titer in plants infected at different time points during development. Plants from line 15d8 were infected with 100 ng ORMV at 2, 3, and 4 weeks after germination. (A) HRF was analyzed in non-infected tissues 1 week after infection. The data are shown as the average HRF per plant (calculated from three repeats, each consisting of 20 plants, with SE). “0w” shows the HRF for control (Ct) – non-infected plants. “Buffer” and “Virus” show buffer-treated and virus-infected plants, respectively. The asterisks show significant differences between the virus- and buffer-treated groups (P < 0.05). The letters indicate whether there is a significant difference between time points in the virus-treated groups. (B) A viral titer was measured in infected leaves at 48 hpi. The data are shown in microgram of ORMV per 10 mg of plant tissue (with SE). Four plants per each data point were analyzed. The letters indicate whether there is a significant difference between time points in the virus-treated groups.

