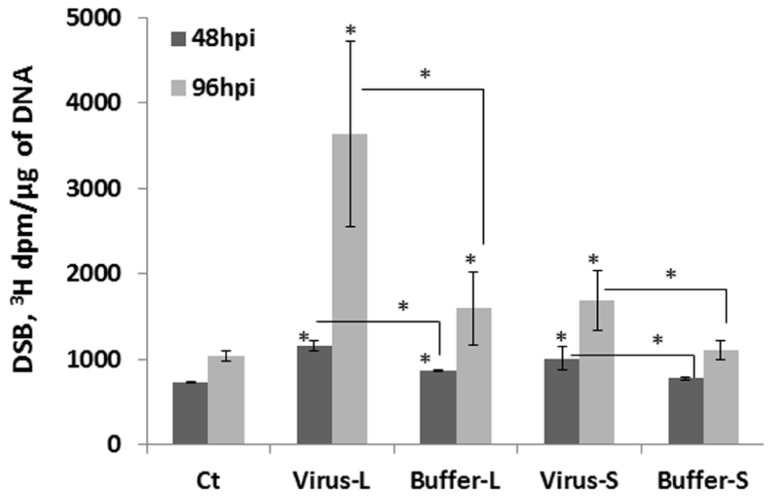
FIGURE 6.
The level of double-strand breaks in infected and non-infected leaves. Plants from line 15d8 were either infected with 100 ng ORMV or treated with buffer. The treated and non-treated leaves from four different plants per treatment were taken for the analysis of double strand breaks (DSBs) by the ROPS assay. The data are shown as 3H incorporation in dpm/μg of DNA. The asterisks show a significant difference between the treated groups (virus or buffer) and the control as well as between the virus-treated and buffer-treated groups (P < 0.05).

