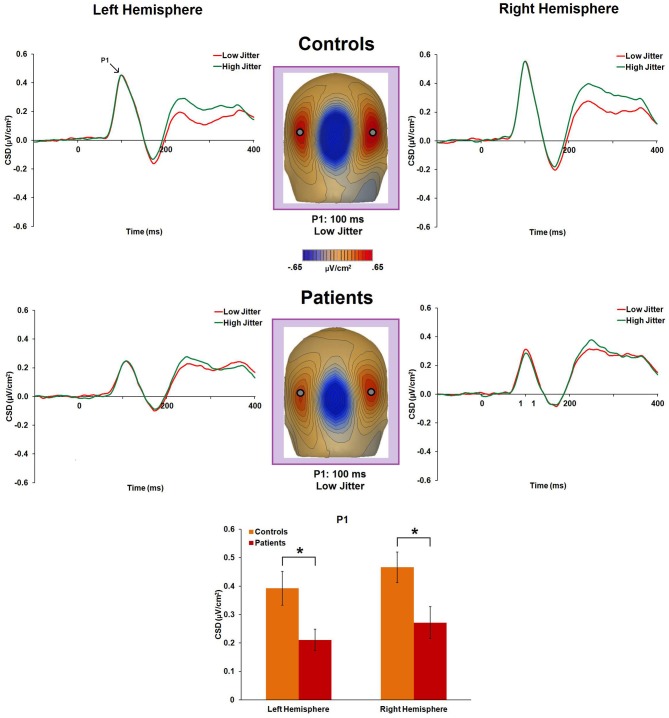
Figure 3.
Event-related potential CSD responses to low- and high-jitter stimuli from occipital electrodes (left hemisphere: P3, P5, PO7; right hemisphere: P4, P6, PO8) for the P1 component. The graphs indicate no significant differences between the jitter conditions in either group. CSD maps at 100 ms show the observed positivity (P1) in controls and in patients for the low-jitter condition. The bar graph shows significant differences between the groups in the responses to the low-jitter stimuli. *p < 0.05.

