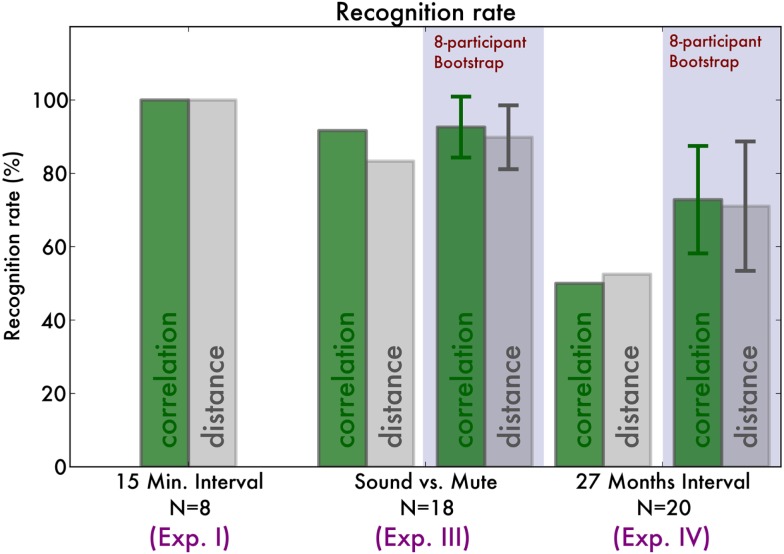
Figure 5.
Overview of the recognition rates of our recognition algorithm. The green bars indicate the correct classification rate by maximizing fingerprint correlation, and the gray bars by minimizing fingerprint distance. For comparison, we indicate the bootstrap classification results, indicating for each experiment the average recognition rates across eight-pianist bootstrap samples. Error bars indicate the standard deviation of the recognition rates.

