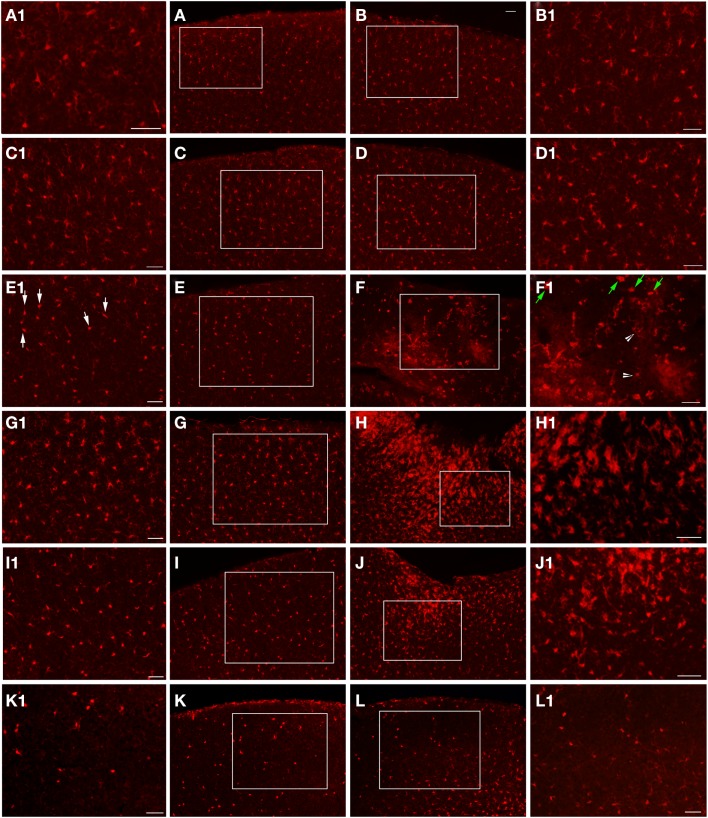
Figure 6.
Epi-fluorescent microscopy of Iba1-labeling following FPI. In (A,B), images are from a naïve control mouse. In (C,D), images are from a sham mouse. Note the typical distribution of Iba1-labeled microglial cells in both of these animals. Enlargements (A1–D1) are provided in order to illustrate the normal appearance of resting microglial cells in the region corresponding to the FPI-induced lesion (B,D) and the region corresponding to this area in the contralateral hemisphere (A,C). Note that microglial cells in normal conditions show minimal overlap, with each cell occupying a specific domain within the parenchyma. At 1-day post-FPI (E,F), some of the Iba1-labeled microglial cells in the contralateral hemisphere (E1) exhibit the early stages of microglial activation (white arrows). In the peri-lesion region (F1), robust Iba1-labeling is apparent. Many of these labeled cells at this timepoint exhibit a relatively simple morphology (green arrows) and to a lesser extent more complex microglial cells (white arrowheads) are also evident (Shapiro et al., 2008). At 3 days post-FPI (G,H), microglial activation is increased in the contralateral hemisphere (G) relative to 1-day post-FPI. In the peri-lesion region (H), a robust Iba1-labeling is observed. At 7 days post-FPI (I,J), the distribution and appearance of Iba1-labeled microglial cells in the contralateral hemisphere (I) is similar to 1-day post-FPI. In the peri-lesion area (J), the microglial response is decreased relative to the 3-day timepoint, although there is still a substantial appearance of activated microglial cells. At 30 days post-FPI (K,L), the Iba1-labeled microglial cells in the contralateral hemisphere (K) appear to be depleted. Of the few remaining Iba1-labeled microglial cells, many continue to exhibit an activated morphology. Similarly in the peri-lesion region (L), there is a noticeable lack of Iba1-labeled microglial cells in layers I–IV in the region subjacent to where the lesion occurred. In layers V and VI, there are considerably more Iba1-labeled microglial cells, some of which exhibit varying degrees of activation. Scale bar in (B) = 50 μm for images (A–L). Scale bar = 50 μm in images (A1–L1).

