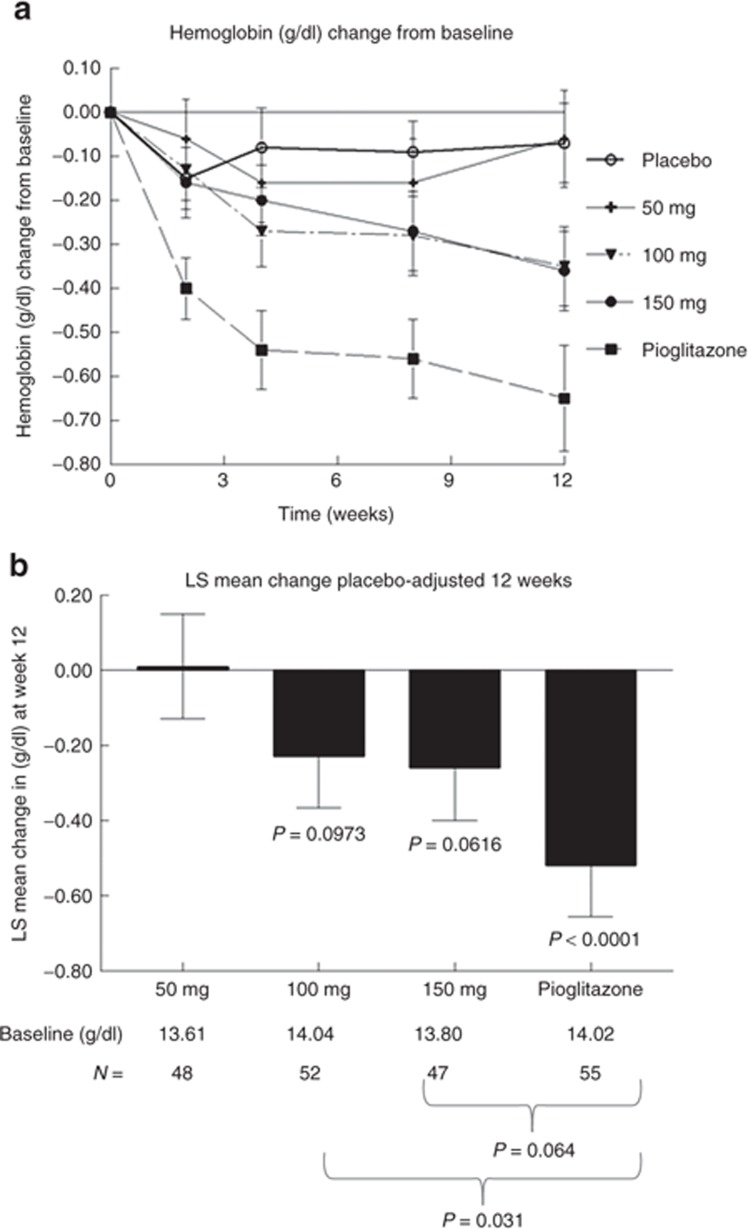
Figure 3.
Effect of 12 weeks of treatment on total hemoglobin as a marker of fluid retention. Data show the change in total hemoglobin (g/dl) from baseline for each of the five treatment groups. (a) The change at each visit during the double-blind treatment period. (b) The placebo-adjusted least-squares change (mean and SE) at the 12-week end point (the last time point in (a)). The starting values of total hemoglobin and the number per group are shown below the bar chart. P values under the bars depict the least-squares change from baseline. P values below the panel show the differences between the MSDC-0160 groups and the pioglitazone group. LS, least squares.

