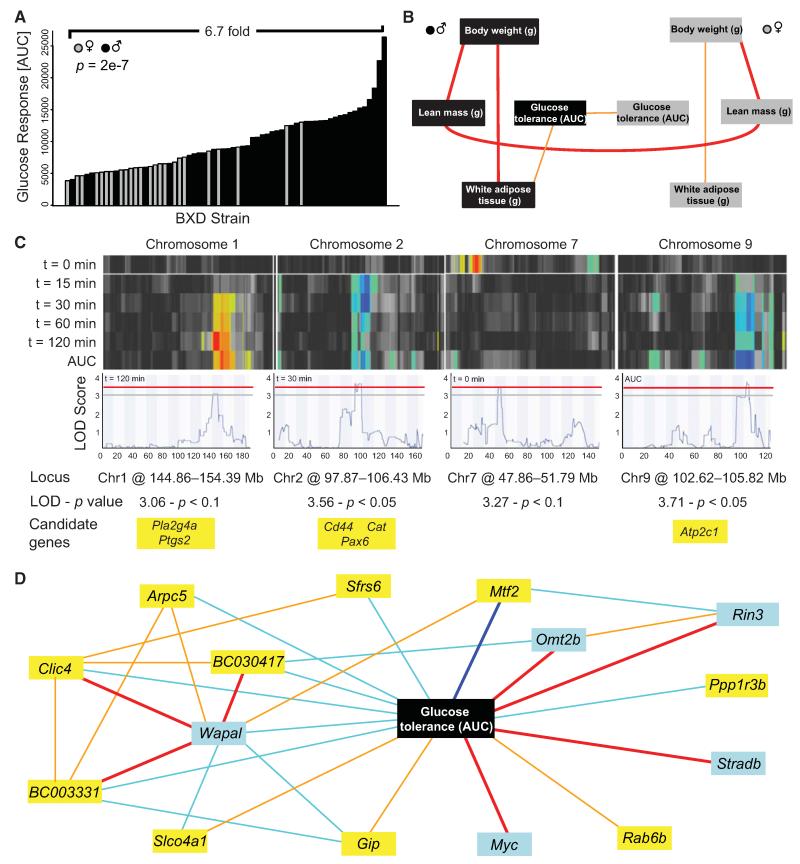
Figure 6. Analysis of Response to an Intraperitoneal Glucose Tolerance Test.
(A) Variation of the AUC of the glucose levels from 0 to 120 min.
(B) Network of glucose tolerance response determinants in males and females. Full details are given in Table S2.
(C) Multiple and single QTL heat map for glucose levels at each time point. Loci switch according to the feeding status of the mice. Fasting glucose (t = 0 min) maps appear only on Chr7. The early response to glucose injection (t = 15 min) maps on Chr2 only, whereas the rest of the time points also map on Chr1 and Chr9. Candidates under each QTL were selected according to existing literature showing their link with type 2 or type 1 diabetes. Further details are given in Figure S4.
(D) Network built around overall glucose response by using gene expression in the liver. Among the top 500 liver mRNA correlates with AUC, two were located on Chr1 QTL (Arpc5 and BC003331) and one on Chr9 QTL (Rab6b) (yellow boxes). One gene had a transQTL on the Chr1 QTL (Ppp1r3b), four had transQTLs on the Chr2 QTL (Sfrs6, Clic4, Slco4a1 and Mtf2), and one had a transQTL on the Chr9 QTL (Gip) (yellow boxes). Light blue boxes are attributed to the five genes that best correlated with AUC (Wapal, Rin3, Omt2b, Stradb and Myc). Bold dark blue lines represent −1 < r < −0.7, light blue lines −0.7 < r < −0.5, light orange lines 0.5 < r < 0.7 and bold red lines 0.7 < r < 1.

