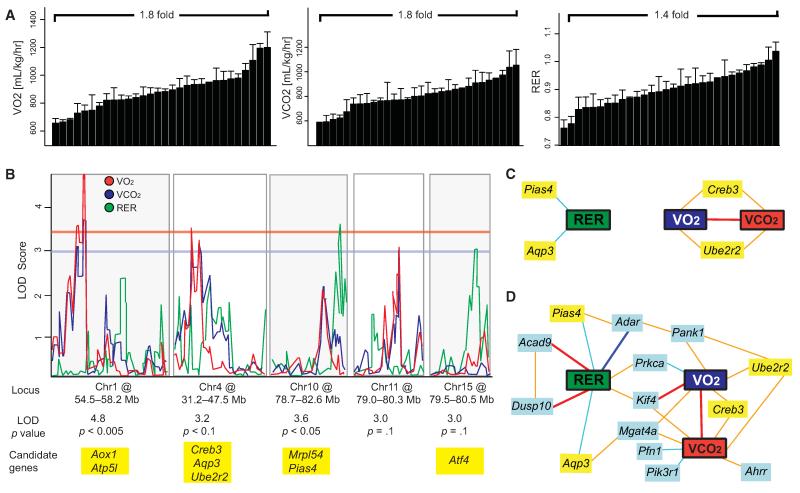
Figure 7. Regulatory Network Underlying Differences in Respiration.
(A) Variation among male strains of BXD mice in three parameters of respiration: VO2, VCO2, and RER. Variation across and correlation with female strains is given in Figure S3.
(B) QTL graphs of the three respiratory parameters, VO2 (blue), VCO2 (red), and RER (green). Significance is shown by the red horizontal line, suggestive by the blue line (LOD > 3.3 and 3.0, respectively). Candidate genes with established links to energy expenditure are listed below the locus (Aox1, Atp5l, Creb3, Ube2r2, Aqp3, Mrpl54, Pias4, Tab1, and Atf4).
(C) Network graph showing all positional candidates with mRNA expression that correlates significantly with the phenotypes in whole-eye tissue (Geisert et al., 2009).
(D) Expanded network graph using the same data set, including the top ten mRNA correlates of the phenotypes (light blue boxes). Interestingly, RER had the strongest top mRNA correlates (Acad9, Dusp10, and Adar), whereas Kif4 was the only significant correlate of all three parameters, and the only strong (|r| > 0.7) mRNA correlate to VO2 and none were observed for VCO2. Prkca and Mgat4a were shared significantly between two parameters. Despite the strong correlation between VO2 and VCO2, most top correlates were not shared. Bold dark blue lines represent −1 < r < −0.7, light blue lines −0.7 < r < −0.5, light orange lines 0.5 < r < 0.7 and bold red lines 0.7 < r < 1. Bar graphs are expressed as mean + SEM.
Related to Figure S5.

