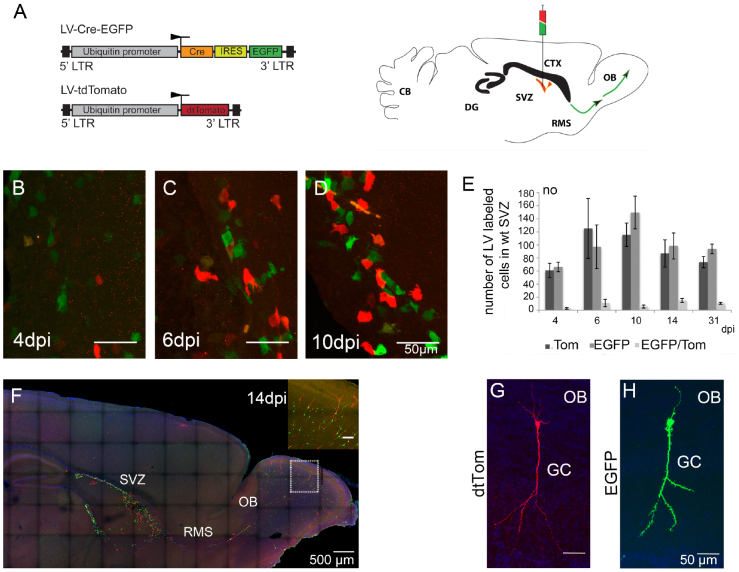
Figure 2. LV delivery into the SVZ of postnatal wt mice.
(A) A schematic drawing showing the lentiviral vectors used for injection (left). LV-Cre-EGFP induces the γ-pcdh conditional ko and labels cells with EGFP (green), LV-tdTom infects wt cells, labled in red. Schematic drawing of an adult mouse brain showing the injection site in the SVZ, the syringe demonstrating the ‘cocktail injection' of the LV-Cre-EGFP (in green) and LV-tdTom in red (right). The SVZ is marked in red color, green arrows indicate the RMS. (B–D) Cell morphology of LV infected cells (EGFP+ cells in green; Tom+ cells in red) in the SVZ at 4, 6, and 10 dpi. (E) Bar-graph showing the numbers of Tom+, EGFP+ and Tom+, EGFP+ double positive cells in the SVZ at 4, 6, 10, 14 and 31 dpi, indicating a stable infection efficacy by both LVs (ANOVA, p < 0.001; Student's t-test, p < 0.05). (F) A parasagittal section of a wt brain at 14 dpi showing distribution of EGFP+ (green, γ-pcdh deficient) and Tom+ (red, wt) cells in the SVZ, the RMS, and in the OB. Close-up showing infected olfactory granule cells. (G, H) Tom+ and EGFP+ labeled olfactory GCs in a parasagittal section at 21 dpi showing similar signal intensity and morphology after LV infection. Scale bars in B–D 50 μm, in F 500 μm, in inset 100 μm, in G, H 50 μm.

