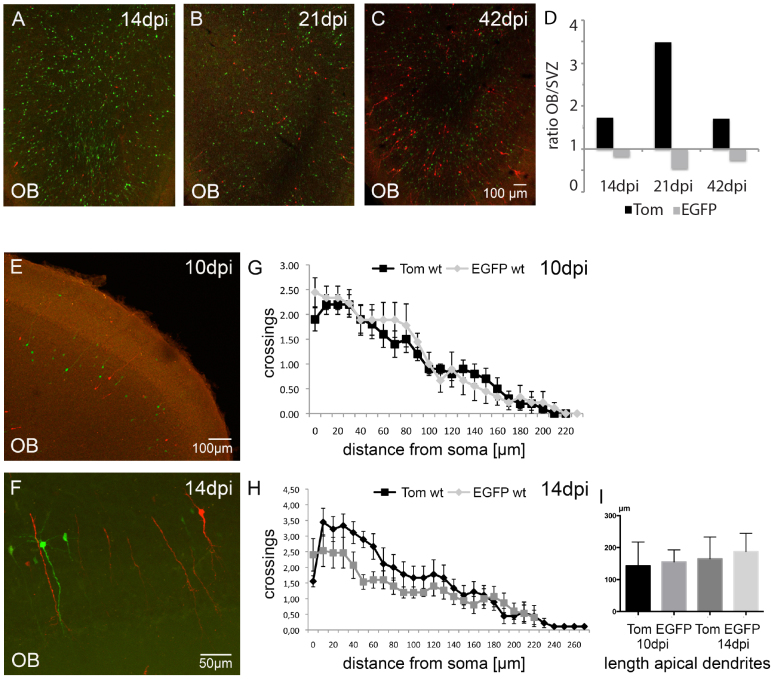
Figure 4. Neurogenesis of EGFP+ γ-pcdh ko cells.
(A–C) Immunolabeling for EGFP and tdTom in γ-pcdhlox/lox injected mice showing EGFP+ and Tom+ olfactory GCs in the OB at 14, 21, and 42 dpi. (D) Bar-graph showing a higher ratio (OB/SVZ) in Tom+ cells compared to EGFP+ cells, indicating less EGFP+ than Tom+ cells that reach the OB. (E, F) Immunolabeling for EGFP+ and Tom+ cells in wt injected mice at 10 and 14 dpi, showing similar fluorophore intensities. (G, H) Sholl analysis for EGFP+ (grey) and Tom+ (black) olfactory wt GCs at 10 and 14 dpi showing no significant differences in dendritic branching. (I) Bar-graph showing quantitative analysis for apical dendrite length for EGFP+ (grey) and Tom+ (black) olfactory wt GCs at 10 and 14 dpi. Scale bars in C 100 μm, representable for A and B, in E 100 μm, in F 50 μm.

