
Figure 6. Proliferation of LV-infected EGFP+ and Tom+ cells.
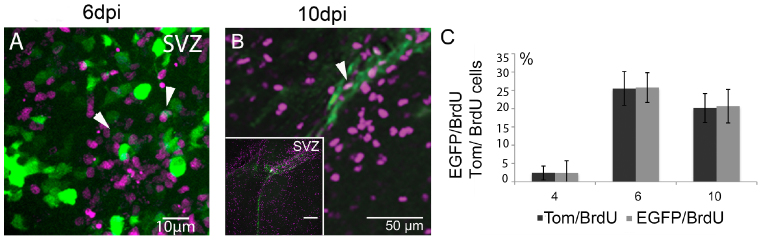
(A, B) Immunolabeling of EGFP+/BrdU+ positive cells on a parasagittal sections from mouse brains at 6 and 10 dpi, showing the distribution of fluorescently labeled cells and co-expression of BrdU and EGFP in the SVZ (white arrows). (C) Bar-graph showing a quantitative analysis of Tom+/BrdU+ and EGFP+/BrdU+ cell numbers in the SVZ in [%]. Scale bars in A 10 μm, in B 50 μm, in inset 100 μm.