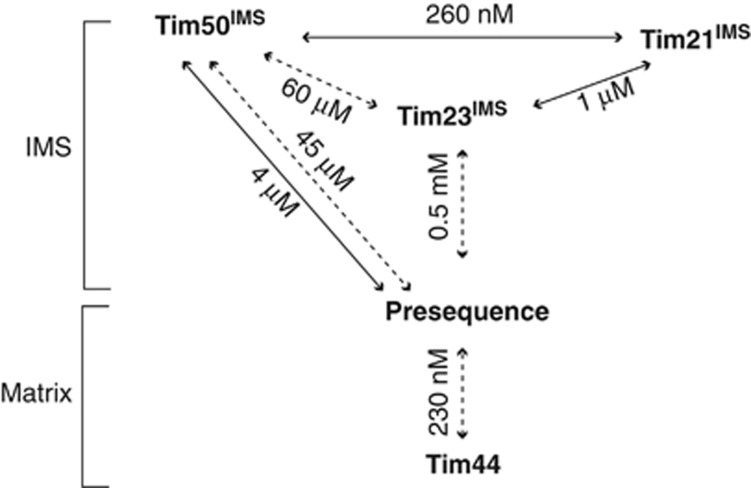
Figure 7.
Affinities of protein–protein interactions within the presequence pathway. KD values of the interactions occurring in the mitochondrial IMS and on the matrix side of the inner mitochondrial membrane are indicated. Solid lines, affinities addressed in this study. Dashed lines, affinity data from Gevorkyan-Airapetov et al (2009); de la Cruz et al (2010); Marom et al (2011).

