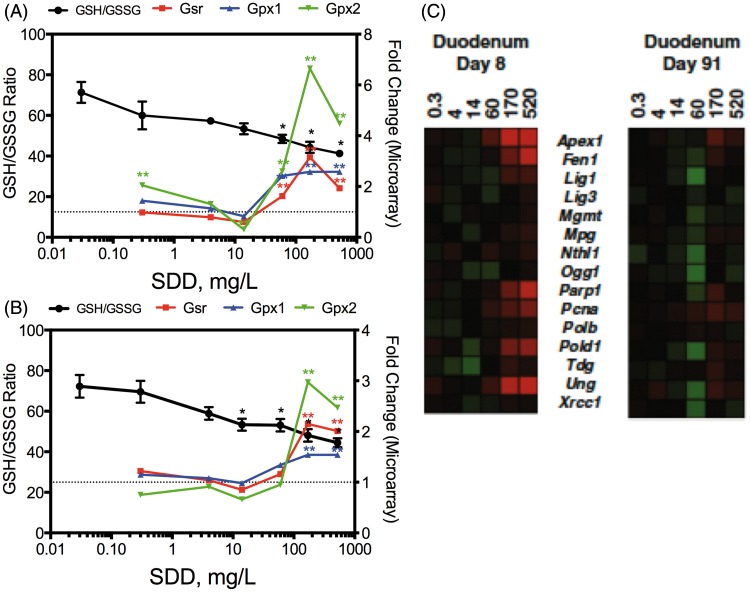
Figure 5.
Redox changes in the intestine at day 8 (A) and day 91 (B). The left axis represents the GSH/GSSG ratio and the right axis shows the fold-change in gene expression. Gsr, glutathione reductase; Gpx, glutathione peroxidase. *Statistically significant decrease in GSH/GSSG ratio by Shirley’s test; **statistically significant increase (>1.5-fold, P1(t) > 0.999) relative to control by empirical Bayes’ method for posterior probabilities. (C) Heat map of DNA repair genes in mouse duodenum at days 8 and 91. Adapted from Kopec et al. (2012a).

