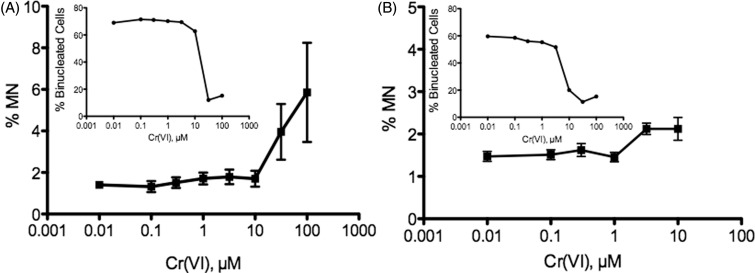
Figure 7.
MN formation in CHO-K1 (A) and A549 (B) cells. Cells were treated with the indicated concentrations of Cr(VI). MN formation in bi-nucleated cells is shown in the larger plots. The insets show cytotoxicity as indicated by decrease in the number of bi-nucleated cells. Data represent mean ± SEM, n = 9.

