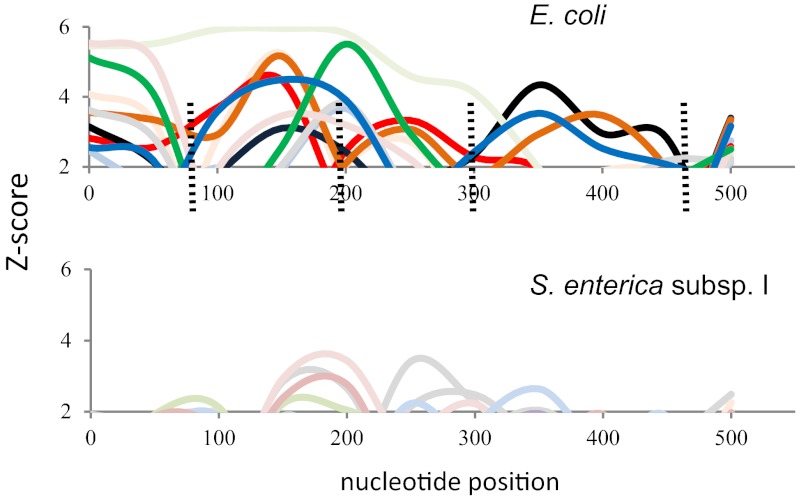
FIG 5 .
Intragenic recombination in E. coli and S. enterica subsp. I fimA as determined by SiScan and MaxChi tests. Combined Z score plots (showing values higher than the threshold score of 1.96, i.e., P < 0.05) obtained for 10 sets of randomly chosen triplet sequences of E. coli and Salmonella are shown. The sequence triplets with recombination signal are shown in bold colors (red, orange, green, blue, and black). The sequence triplets without recombination signal are shown in light colors. Dashed lines indicate frequent recombination breakpoints. Graphs presenting Z score plots for each sequence triplet separately are shown in Fig. S3A and B in the supplemental material. The colors used here correspond to those used in the supplemental figures for these triplets.

