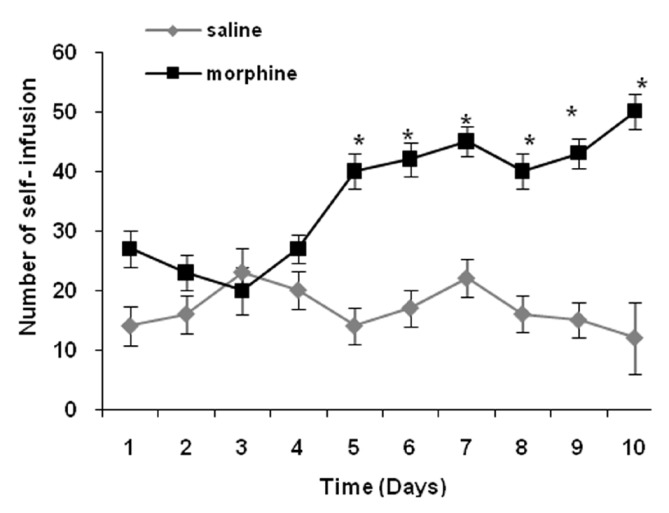
Figure 1.

Comparison numbers of self-infusion (SI) between two groups of control and morphine. Rats received saline (control group) and morphine (morphine group) in self-administration apparatus. Saline 5 μL injected (icv) before each session and number of SI was compared among 2 groups using one-way ANOVA and student's t-test. Data are presented as mean ± SEM. There was significant difference between control and morphine groups. The number of SI in morphine group increased significantly except first 5 days (*P< 0.05)
