
Figure 1. Individual probability of infection by the amphibian chytrid skin fungus and individual thermal history in nature.
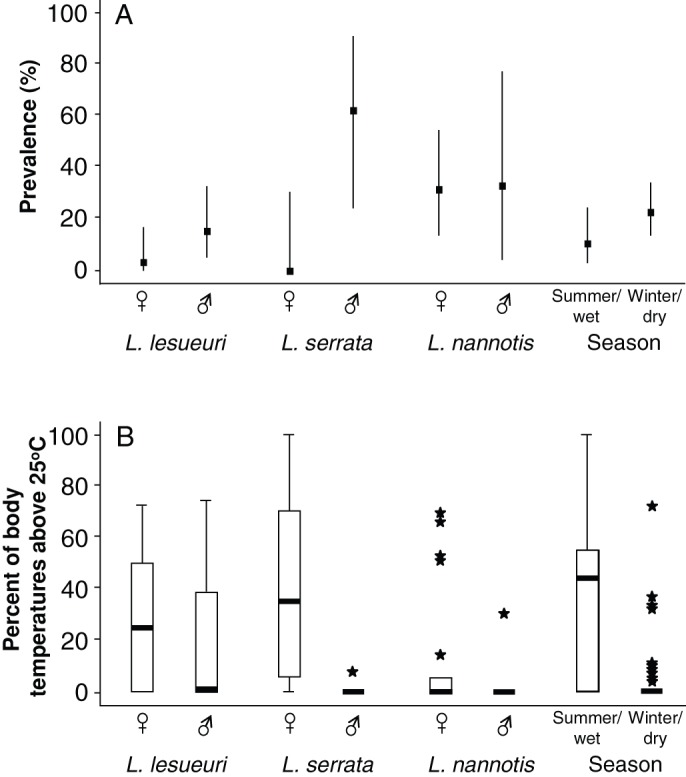
(a) Prevalence of Bd infection in tracked frogs by species and gender and by season. Bars represent binomial (Clopper-Pearson) 95% confidence limits. (b) Boxplots illustrating distribution of percent of frog body temperatures above 25°C by species and gender and by season. Heavy bars represent medians, boxes represent 25% and 75% quartile boundaries, whiskers represent ranges, and stars are points outside 1.5× the interquartile range from the nearest quartile boundary. Comparing (a) and (b) suggests an inverse relationship between prevalence and percent of body temperatures above 25°C; this relationship was explored statistically in the models presented in Table 2.