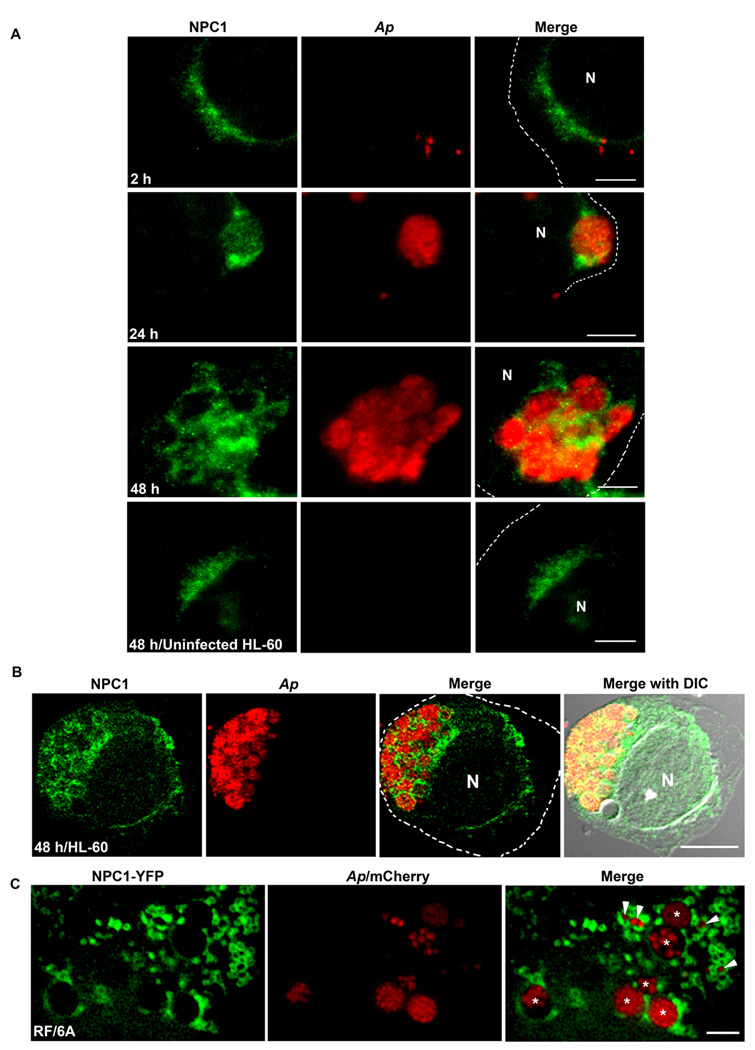
Fig. 2. NPC1 is on A. phagocytophilum inclusions.
A. A. phagocytophilum-infected HL-60 cells were fixed at indicated times pi, stained with anti-NPC1 (green) and mouse anti-A. phagocytophilum P44 antibody 5C11 (red), and analyzed by fluorescence microscopy. The experiment shown is representative of at least four independent experiments. Each dotted line depicts the cell boundary. Bar, 5 µm. Ap, A. phagocytophilum. N, nucleus.
B. A. phagocytophilum-infected HL-60 cells were fixed at 48 h pi, labeled with anti-NPC1 (green) and antibody 5C11 (red), and analyzed by confocal fluorescence microscopy. The experiment shown is representative of at least two independent experiments. Each dotted line depicts the cell boundary. Bar, 5 µm. Ap, A. phagocytophilum. N, nucleus. DIC, differential interference contrast.
C. RF/6A cells were transfected with NPC1-YFP plasmid and inoculated with mCherry-A. phagocytophilum at 8 h post-transfection. At day 2 pi, live cells were observed by DeltaVision fluorescence deconvolution microscopy. Note numerous NPC1 vesicles attaching to A. phagocytophilum inclusions. The experiment shown is representative of at least three independent experiments. Arrows indicate small inclusions, and asterisks indicate larger inclusions. Bar, 5 µm. Ap, A. phagocytophilum. N, nucleus.

