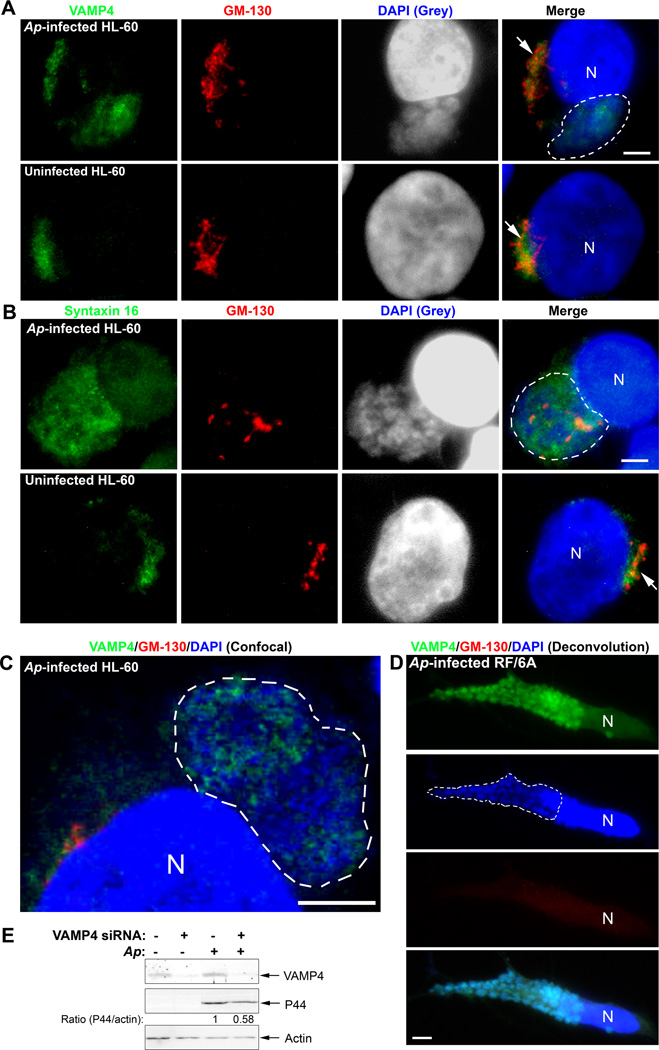
Fig. 6. SNARE proteins VAMP4 and syntaxin 16 are recruited to A. phagocytophilum inclusions.
A–C. A. phagocytophilum-infected and control HL-60 cells were fixed at day 2 pi, stained with anti-VAMP4 (A) or anti-syntaxin 16 (B) (green) and anti-GM-130 (red), and analyzed by fluorescence microscopy (A, B) or confocal microscopy (C). A. phagocytophilum inclusions were visualized by DAPI staining (blue). The experiment shown is representative of two independent experiments. Each Dotted line encircles a cluster of bacterial inclusions. Bar, 5 µm. Ap, A. phagocytophilum. N, nucleus.
D. A. phagocytophilum-infected RF/6A cells at day 2 pi were stained with anti-VAMP4 (green), anti-GM-130 (red), and DAPI (blue), analyzed by DeltaVision deconvolution microscopy. Note highly dispersed and hardly visible GM-130 signal. The experiment shown is representative of two independent experiments. Dotted lines encircle bacterial inclusions. Bar, 5 µm. Ap, A. phagocytophilum. N, nucleus.
E. RF/6A cells were transfected with a control siRNA or a siRNA specific for VAMP4. One day after transfection, A. phagocytophilum was added to the cells and incubated for an additional 2 days. The cells were lysed and subjected to western blotting using antibodies against VAMP4 and A. phagocytophilum P44. Actin was used as the protein input control to normalize each sample. The amounts of VAMP4 and P44 (relative to actin) were determined by densitometry. The values under the bands show the relative ratios of band intensities, with the ratios of those from samples transfected with control siRNA arbitrarily set as 1. Results are representative of three independent experiments. Ap, A. phagocytophilum.

