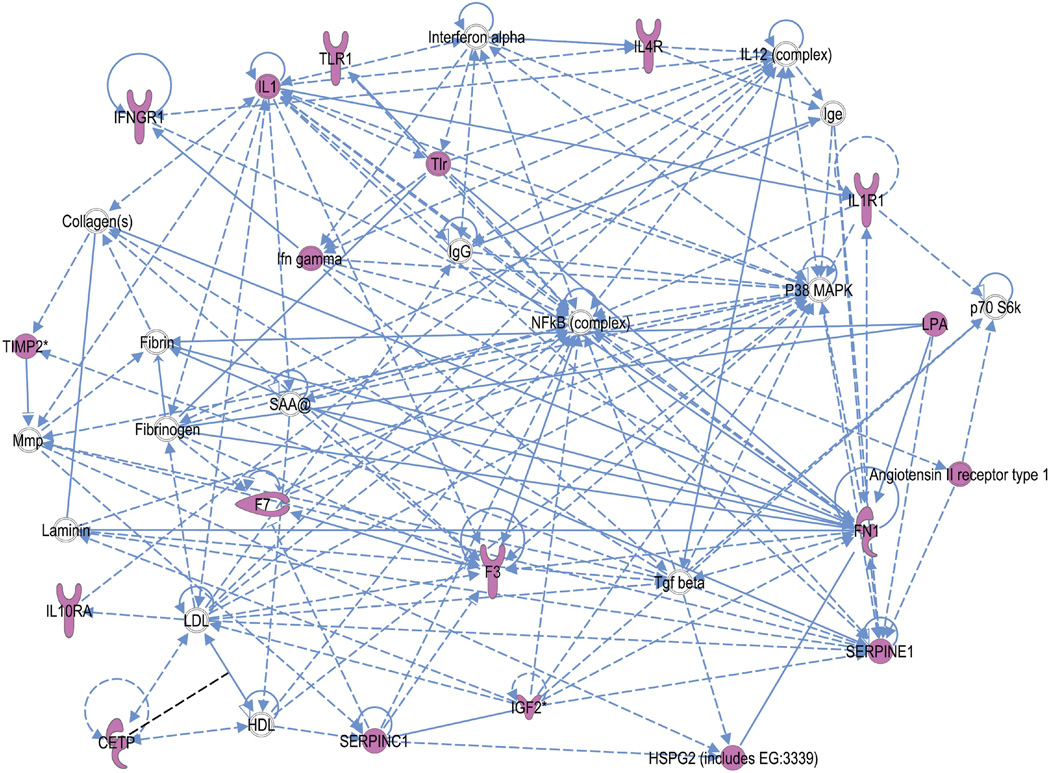
Figure 6.
Connection map for the first ranked network generated by IPA from fetal focus gene input. The biomarkers passing the p < 0.05 significance threshold (focus molecules, depicted in pink) were entered in to the IPA software for an unsupervised functional analysis to discern regulatory networks involving these molecules. The asterisk indicates that there was more than one SNP probe for the gene tested and the most significant value was placed into the analysis. Solid lines show direct interaction (binding/physical contact); dashed line, indirect interaction supported by the literature but possibly involving one or more intermediate molecules that have not been investigated definitively. Molecular interactions involving only binding are connected with a line without an arrowhead since directionality cannot be inferred. The symbol, “SAA@” indicates serum amyloid, which includes SAA1, SAA2, SAA3P, and SAA4.

