Fig. 3.
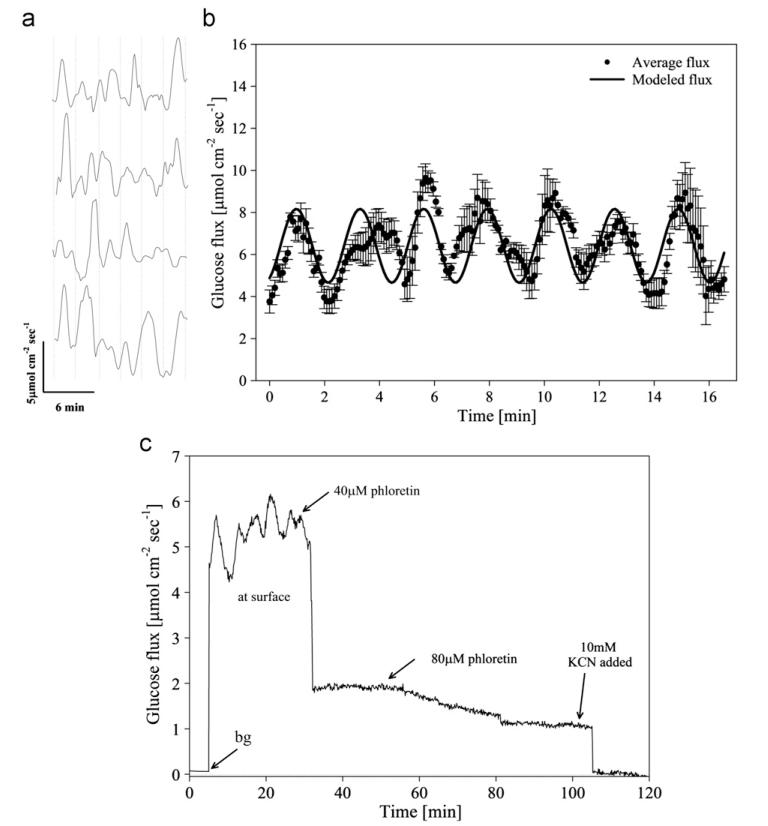
(a) Representative oscillatory glucose flux in four replicate confluent INS 1 clusters out of 12 total. Average oscillation period (indicated by a vertical dashed line) was 2.9±0.6 min (n=12). (b) Average glucose flux (dots, n=12 replicate confluent INS 1 cells) and harmonic oscillator model (solid line): J=J0+a* sin(2π/T) *t(a=1.75 μmol cm−2 s−1, T=2.9 min, J0=6.41 μmol cm−2 s−1). Average basal glucose influx in cultured β cell (INS 1) clusters was 5.9±1.4 μmol cm−2 s−1 (n=12). Correlation coefficient between modeled and measured data was 0.78. (c) Representative glucose flux measured at the surface of cultured INS 1 β cells during inhibition by external addition of phloretin. A minimum of three successive oscillations were measured under basal conditions (average period was 2.9±0.4 min), and glucose transport was then inhibited by addition of 40 μM phloretin and 80 μM phloretin (total concentration noted). Glucose transport was subsequently abolished via addition of 10 mM KCN. (Reprinted with permission from (Shi et al. 2011)).

