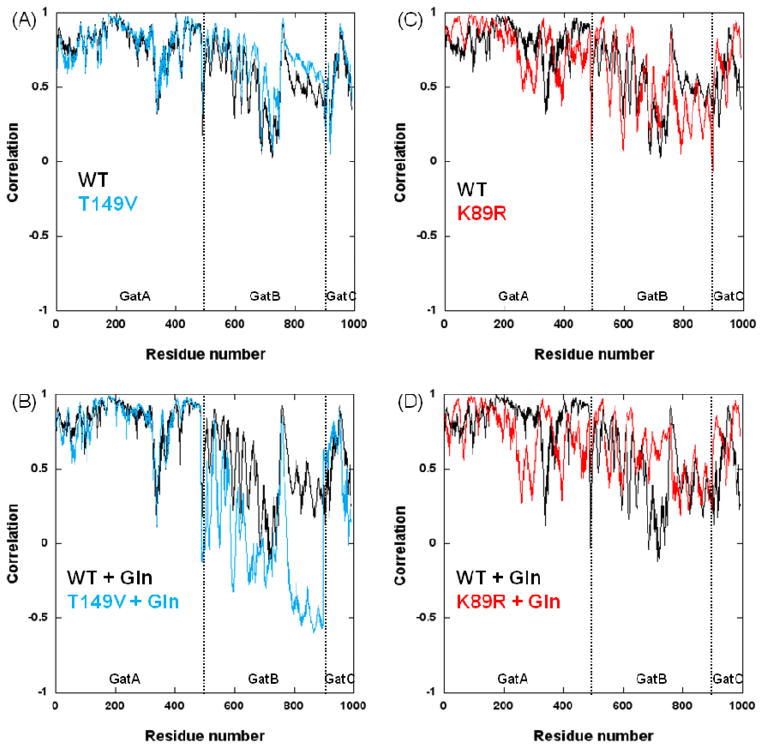
Figure 8.
Correlations between each enzyme residue with the T149 and K89 positions (wild-type and mutant AdTs). (A) Comparison between T149 (black) and T149V (cyan) correlations; (B) Comparison between T149 (black) and T149V (cyan) correlations when simulated in the presence of glutamine bound to GatA; (C) Comparison between K89 (black) and K89R (red) correlations; (D) Comparison between K89 (black) and K89R (red) correlations in the presence of glutamine bound to GatA.

