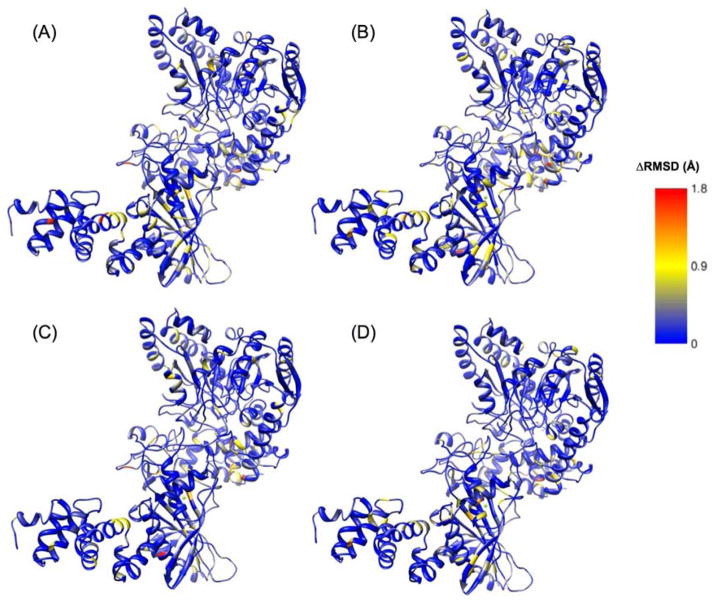
Figure 9.
Differences in RMSD (ΔRMSD) for each mutant versus wild-type AdT (wild-type values were subtracted from mutant values; see text for details). (A) ΔRMSD between T149V AdT simulation, with glutamine bound to GatA, compared to AdT structure; (B) ΔRMSD between T149V AdT simulation in the absence of bound glutamine, compared to AdT structure; (C) ΔRMSD between K89R AdT simulation, with glutamine bound to GatA, compared to AdT structure; (D) ΔRMSD between K89R AdT simulation and AdT structure, in the absence of bound glutamine. Right panel shows the color scheme for panels A–D in Angstroms. Larger representations of these figures are provided in the Supporting Information, Figure S6.

