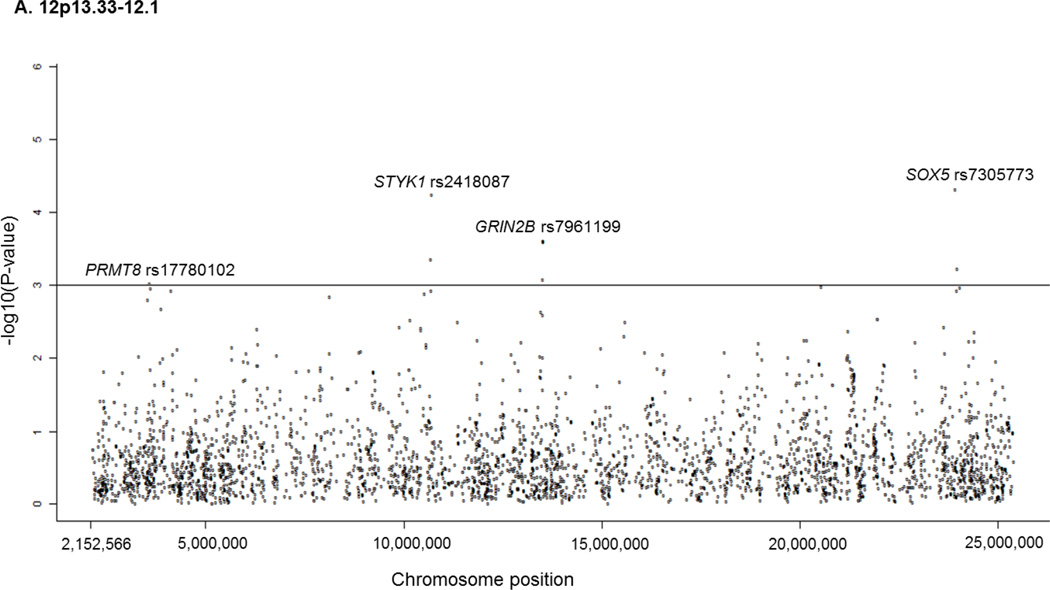
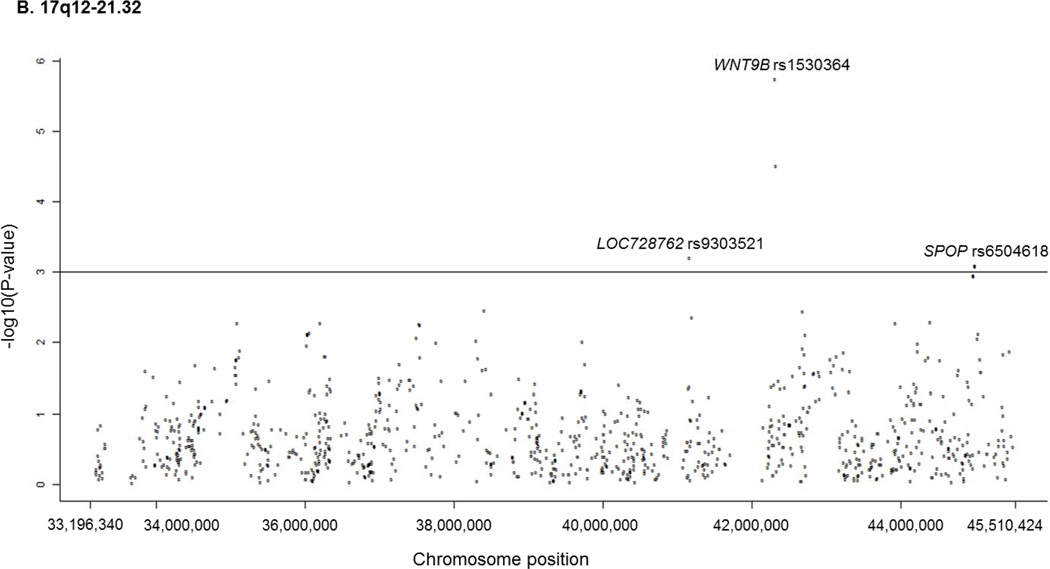
Figure 1. SNP distribution and association results for the two confirmed associated regions: 12p13.33-12.1 (A) and 17q12-q21.32 (B).
Chromosomal positions (x axis) based on NCBI build 36 coordinates. P values (as −log10 values; left y axis) are shown for SNPs analyzed in the discovery study. The solid dot means dominant model, the open dot means recessive model.


