
Figure 4.
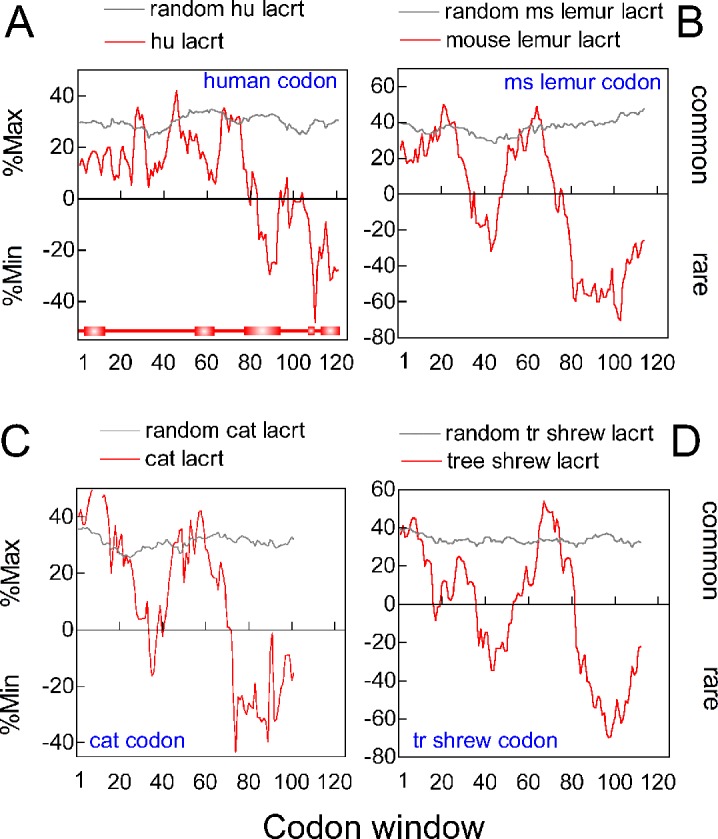
Rare codon clustering in the 3′ region of primate and nonprimate LACRT coding sequences. (A) RCC analysis of human LACRT coding sequence (red tracing) versus randomized control (grey tracing). Analysis was with the human codon frequency table. Bottom: linear diagram of lacritin with signal peptide and PSIPRED predicted α-helices aligned by codon number, but lacking eight C-terminal amino acids as per the last codon window (codons 112–130, centered on 121), in keeping with an 18 nucleotide window. (B) RCC analysis of mouse lemur (Microcebus murinus) LACRT coding sequence, using the M. murinus codon frequency table. (C) RCC analysis of cat (Felis catus) LACRT coding sequence with the F. catus codon frequency table. (D) RCC analysis of tree shrew (Tupaia belangeri) using T. belangeri codon frequencies. (A) through (D) were calculated with coding sequence for the signal peptide included.