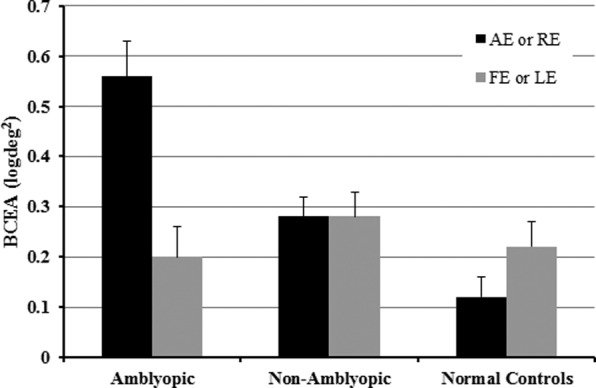
Figure 2.

Comparison of mean (± SEM) log10 95% BCEAs for amblyopic eyes (AE) and fellow eyes (FE) of amblyopic children, and right and left eyes (RE, LE) of nonamblyopic children and normal controls.

Comparison of mean (± SEM) log10 95% BCEAs for amblyopic eyes (AE) and fellow eyes (FE) of amblyopic children, and right and left eyes (RE, LE) of nonamblyopic children and normal controls.