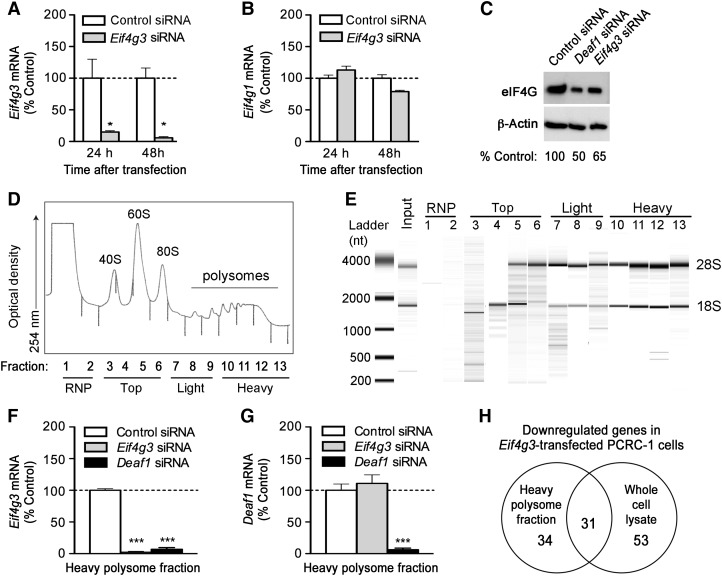
Figure 5.
Polysome analysis of Eif4g3-silenced PCRC-1 cells. (A and B) PCRC-1 cells were treated with control or Eif4g3 siRNA, and qPCR was performed to measure Eif4g3 and Eif4g1 mRNA expression at various times after transfection (mean ± SEM of three independent experiments, *P < 0.05, two-tailed unpaired Student's t-test). (C) Representative immunoblots showing eIF4G and β-actin (loading control) expression 48 h after transfection with control, Deaf1, or Eif4g3 siRNA. (D) Polysomes were isolated from PCRC-1 cells, and 13 fractions of increasing density were collected. These contain the RNP (fractions 1–2), top fractions (fractions 3–6), light polysome fraction (fractions 7–9), and heavy polysome fraction (fractions 10–13). The optical density of each fraction isolated from control siRNA-treated cells, 48 h after transfection, is shown. (E) A representative bioanalyzer gel image showing the RNA extracted from each fraction collected from control siRNA-treated cells, 48 h after transfection. The 18S and 28S rRNA bands are indicated. (F and G) qPCR measurements of Eif4g3 and Deaf1 gene expression in the heavy polysome fractions. RNA samples were isolated from fractions collected 48 h after siRNA transfection, and fractions 10–13 were pooled prior to qPCR analysis. Data represent the mean ± SEM of three independent experiments (***P < 0.0005, two-tailed unpaired Student's t-test). Data shown in C–E are representative of three independent experiments. See also Supplementary Figure S2. (H) Venn diagram showing the number of genes that are down-regulated by ≥2-fold in the heavy polysome fraction and total cell lysate of Eif4g3-silenced PCRC-1 cells vs. control-siRNA-treated controls, as measured by two-color microarray analysis. Only genes that were reduced by ≥2-fold in at least three out of four individual experiments are included.

