Figure 6.
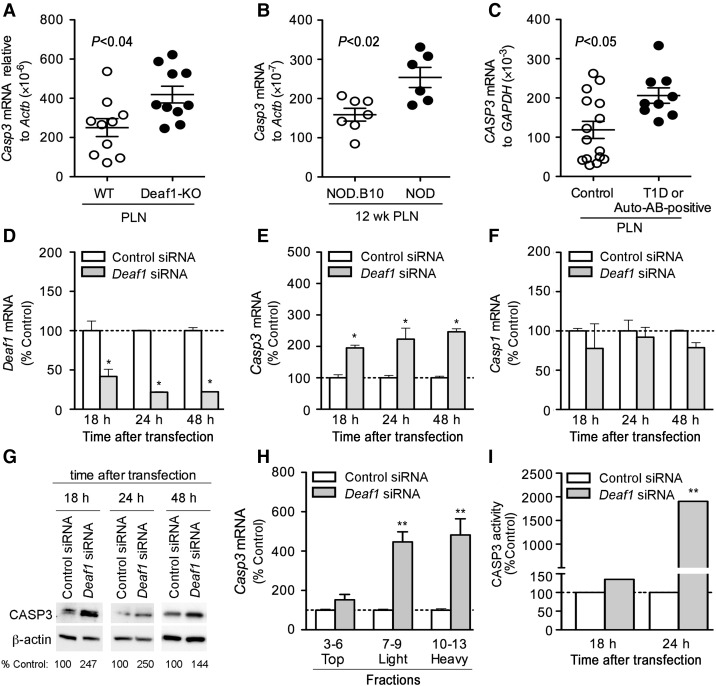
Deaf1 regulates Casp3 expression in PCRC-1 cells. qPCR analysis showing up-regulated Casp3 (A and B) and CASP3 (C) mRNA expression in the PLNs of Deaf1-KO mice vs. littermate controls (A), 12-week-old NOD mice vs. age-matched NOD.B10 controls (B), and T1D/auto-antibody-positive patients compared with non-disease controls (C). P-values are indicated on graphs and determined using the two-tailed Mann–Whitney test. PCRC-1 cells were transfected with control or Deaf1 siRNA and QPCR was performed to measure Deaf1 (D), Casp3 (E) and Casp1 (F) expression at various times after transfection (mean ± SEM of three independent experiments, *P < 0.05, two-tailed unpaired Student's t-test). (G) Representative immunoblots showing CASP3 and β-actin (loading control) expression in PCRC-1 cells, 18, 24, and 48 h after transfection with control or Deaf1 siRNA. Low amounts of CASP3 expression were also observed in untransfected and mock-transfected cells (Supplementary Figure S3D). (H) qPCR analysis of Casp3 expression in various polysome fractions isolated from PCRC-1 that were transfected with control or Deaf1 siRNA. RNA samples were collected 48 h after transfection, and pooled as indicated prior to qPCR analysis. Data represent the mean ± SEM of three independent experiments (**P < 0.005, two-tailed unpaired Student's t-test). (I) CASP3 activity measured in PCRC-1 cells at various times after transfection with control or Deaf1siRNA (mean ± SEM of three independent experiments, **P < 0.005, two-tailed unpaired Student's t-test). See also Supplementary Figure S3.

