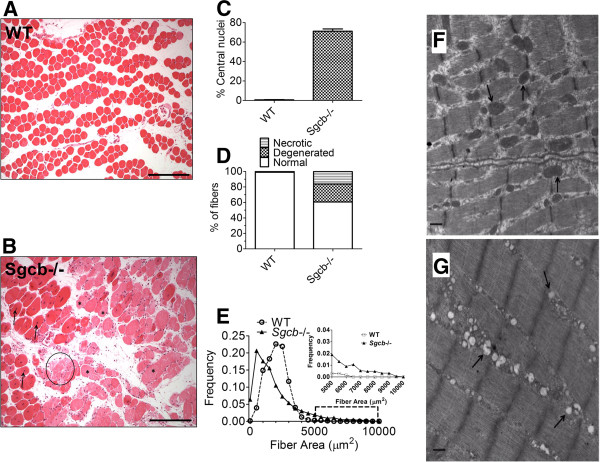
Figure 1.
EDL muscles from β-sarcoglycan deficient mice exhibit dystrophic morphology and abnormal mitochondrial morphology. (A, B) EDL muscle cross-sections from wild-type (WT) and β-sarcoglycan mice stained with hematoxylin and eosin. (C) Percentage of fibers with the nucleus localized in the center (average ± SEM). (D) Percentages of normal, degenerated (weak eosin staining, examples indicated by asterisk) and necrotic (loss of eosin stain and swollen fiber, example indicated by a circle) muscle fibers. (E) Fiber size was more variable in Sgcb−/− EDL. This is indicated by the difference in the frequency distribution of fiber cross-sectional area. The inset in (E) is an expansion of the region indicated by the dashed rectangle in the main graph. Data were obtained from four mice and > 600 fibers in each group. The scale bar in images (A) and (B) indicate 250 μm. Representative electron microscopy images of EDL muscle from (F) WT and (G) Sgcb−/− mice. Arrows indicate normal mitochondria (F) or mitochondria with abnormal morphology, including low cristae density (G). Images from 11 fibers and two mice in each group were investigated under blinded conditions. The sample is magnified at × 25,000. Scale bar indicates 500 nm.

