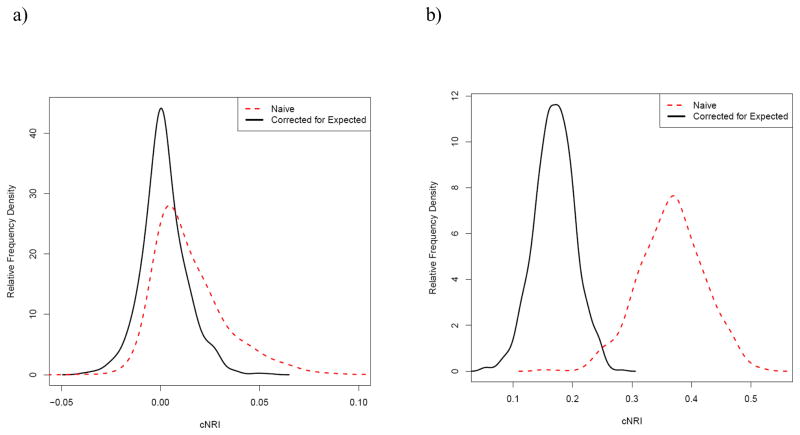
Figure 1.
Distribution of the cNRI with the proposed correction for the expected distribution and the naïve cNRI for simulations comparing reclassification for a model based on both X (true OR of 8) and Y (true OR of 1 for (a) and 3 for (b)) to a model based only on X. The sample size for each simulation was 5000, with a base event probability of 10% and reclassification cut points at 5%, 10% and 20%.

