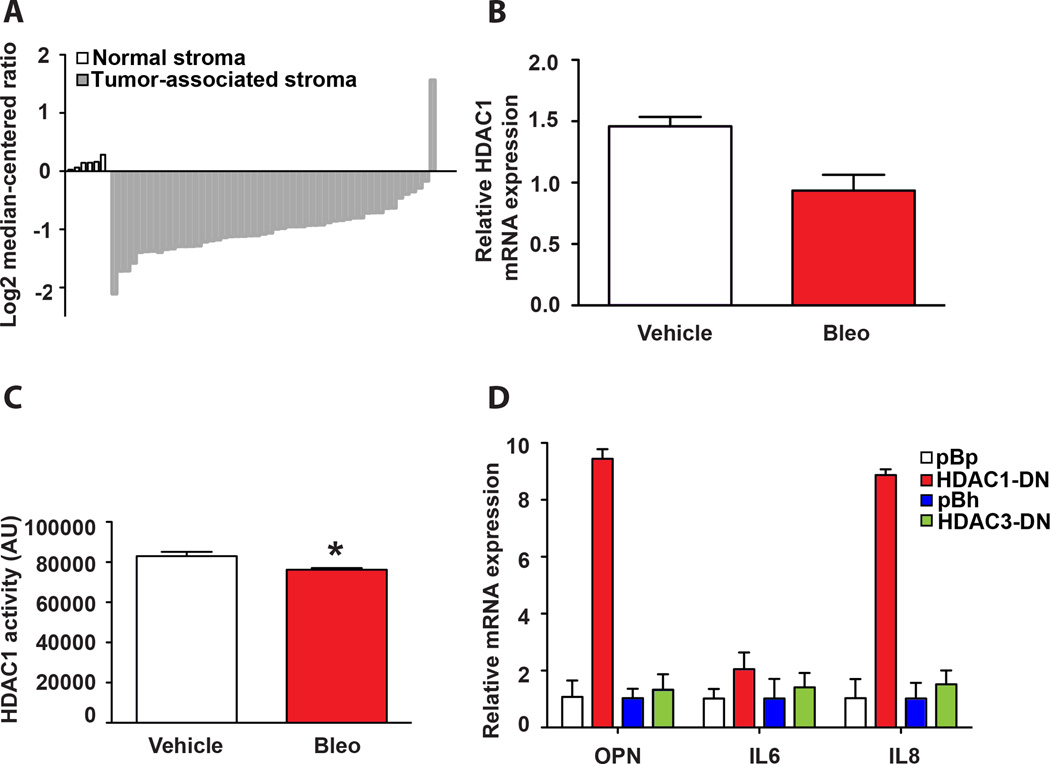
Figure 5. Inhibition of HDAC1 leads to OPN upregulation.
A. Oncomine expression analysis of HDAC1 levels between normal stroma and invasive breast cancer-associated stroma extracted from the Finak et. al. study (29). Expression values are log transformed and median-centered per array (see Materials and Methods). B. HDAC1 mRNA levels were measured by qPCR in vehicle and bleomycin-treated BJ fibroblasts. The mean ± STDEV is shown (n=3). C. HDAC1 activity was measured in lysates from vehicle or bleomycin-treated cells after immunoprecipitation of HDAC1 with an HDAC1 antibody. The mean ± SEM is shown, * p < 0.05, (n=3). D. OPN, IL6 and IL8 mRNA levels were quantified by qPCR in BJ fibroblasts transduced with a vector control (pBp or pBh) or a dominant negative cDNA of HDAC1 (HDAC-DN) or HDAC3 (HDAC3-DN). The mean ± STDEV is shown (n=3).

