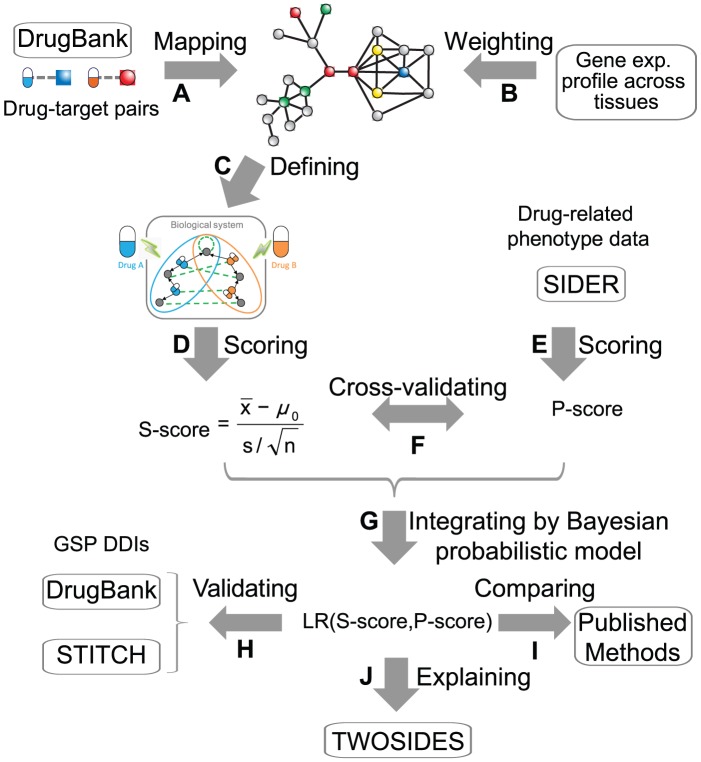
Figure 2. Algorithmic pipeline.
(A) Mapping drugs onto PPI network through drug-target associations. (B) Weighting PPI network by gene expression profile across human tissues. (C) Defining target-centered system, including known drug-targets and their first-step neighbor protein on PPI network. (D) Scoring systematic connectivity based on drugs' target-centered systems (S-score). (E) Scoring phenotypic similarity based on drug clinical side effects (P-score). (F) Cross-validating between S-score and P-score. (G) Integrating by a Bayesian probabilistic model. (H) Validating the prediction performance using GSP DDIs from two independent databases, DrugBank and STITCH. (I) Comparing with other methods. (J) Explaining the molecular mechanisms of the polypharmacy side effects recorded in TWOSIDES.

