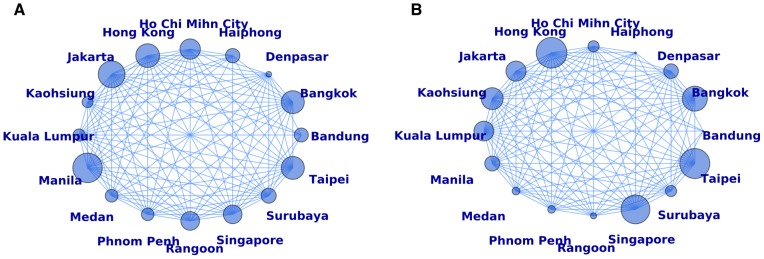
Figure 1. Network representation of 16 cities in Southeast Asia used for the simulations.

An edge connecting two cities represents daily travel between those cities. The size of the nodes in (A) correspond to the population size relative to the total population in the network. The size of the nodes in (B) correspond to the flux of passengers traveling through each city relative to the total number of flights in the network. The base case simulations were started in Jakarta, which accounts for 12.8% of the total population of the network but only 7% of the total daily travel goes through it.
