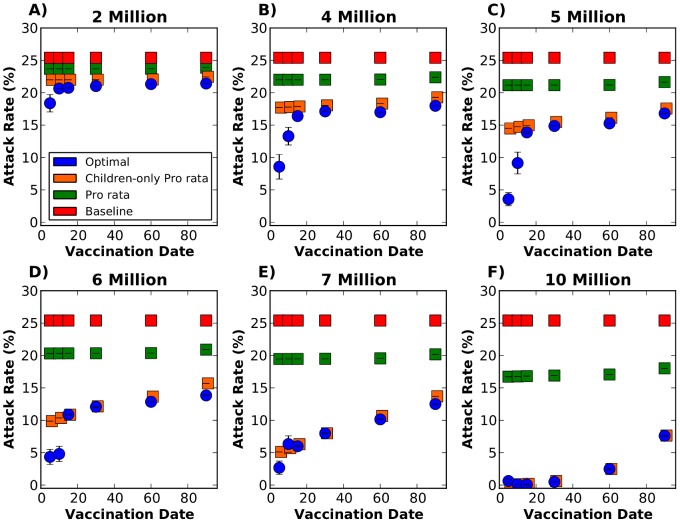
Figure 2. Attack rate with 95% bootstrapped CI with the epidemic starting in Jakarta.
This figure shows the results for a single intervention for six different vaccination days considered and six different vaccination coverages. Each panel represents a given number of vaccine doses available to distribute in the entire network: A) Two million doses. B) Four million doses. C) Five million doses. D) Six million doses. E) Seven million doses. F) Ten million doses. For each panel, each point in the graph corresponds to the attack rate for a single vaccination day, either on day 5, 10, 15, 30, 60, or 90 after the beginning of the epidemic. The optimal, pro rata and children-only pro rata strategies are shown in blue, green and orange respectively. The baseline scenario (red) indicates no vaccination. For each vaccination coverage and day combination, the optimal strategy considerably outperformed the pro rata strategy. When vaccination occurs early in the epidemic, and few doses are available, the optimal strategy also outperforms the children-only pro rata strategy.

