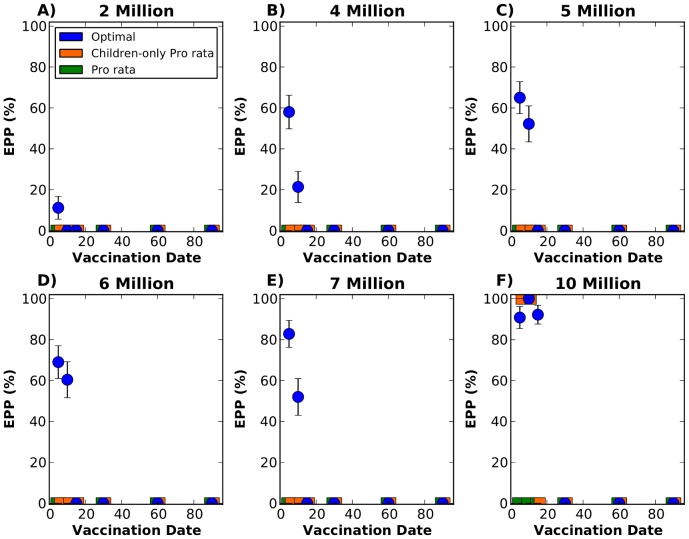
Figure 3. Epidemic prevention potential (EPP) with 95% bootstrapped CI with the epidemic starting in Jakarta.
Each panel represents a given number of vaccine doses available to distribute in the network. A) Two million doses. B) Four million doses. C) Five million doses. D) Six million doses. E) Seven million doses. F) Ten million doses. Each point in each graph corresponds to the EPP for a single vaccination day, either on day 5, 10, 15, 30, 60, or 90 after the beginning of the epidemic. The optimal, pro rata and children-only pro rata strategies are shown in blue, green and orange respectively. When fewer than 10 million doses of vaccine are available, only the optimal strategy is capable of mitigating a significant fraction of the epidemics if vaccination starts early. With as few as 4 million doses, the optimal strategy can mitigate as many as 57% of the epidemics.

