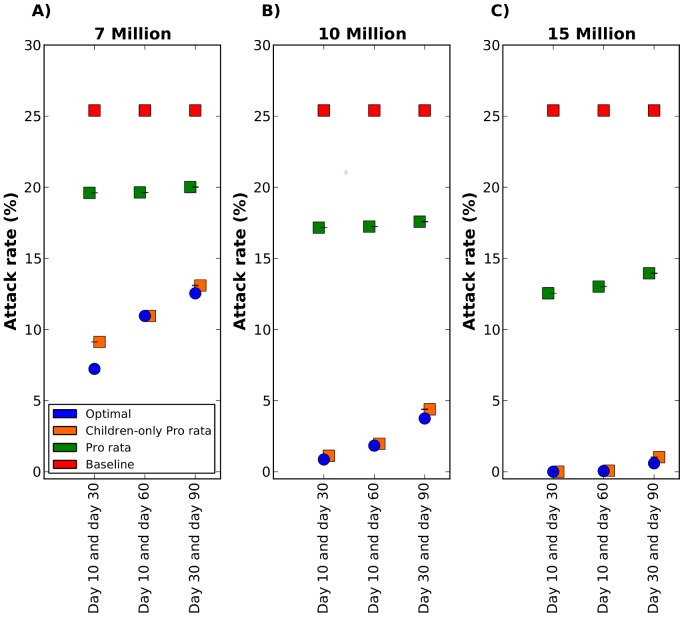
Figure 6. Attack rate for vaccine allocation in two batches on two different days.
Three vaccine coverages are considered: A) Seven million doses of vaccine total, with two million available on the first day and five million available on the second day. B) 10 million doses of vaccine total, with five million doses of vaccine available on each day. C) 15 million doses of vaccine total, five million doses available on the first day and 10 million doses available on the second day. In each panel, three combinations of vaccination days are considered: vaccination on day 10 and day 30, day 10 and day 60, or day 30 and day 90. Here, the epidemic was seeded in Jakarta. The optimal, pro rata and children-only pro rata strategies are shown in blue, green and orange respectively. Here, the optimal strategy and the children-only pro rata strategy yield similar attack rates for all scenarios considered except for one. When seven million doses of vaccine are available at days 10 and 30, the optimal strategy yield a slightly lower attack rate than the children-only pro rata strategy.

