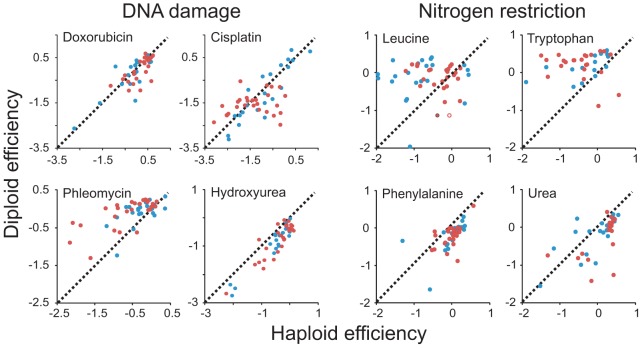
Figure 3. Patterns of ploidy–environment interactions refute generalizing hypotheses on the effects of mutational load, toxin exposure, and nutrient restriction.
Performance of haploid (n = 4) and diploid (n = 2) versions of individual S. cerevisiae (blue) and S. paradoxus (red) strains in DNA damage inducing environments and nitrogen restricted environments. Note that data is shown on a log(2) scale. Broken lines indicate the 1∶1 correlation (null hypothesis expectation).

