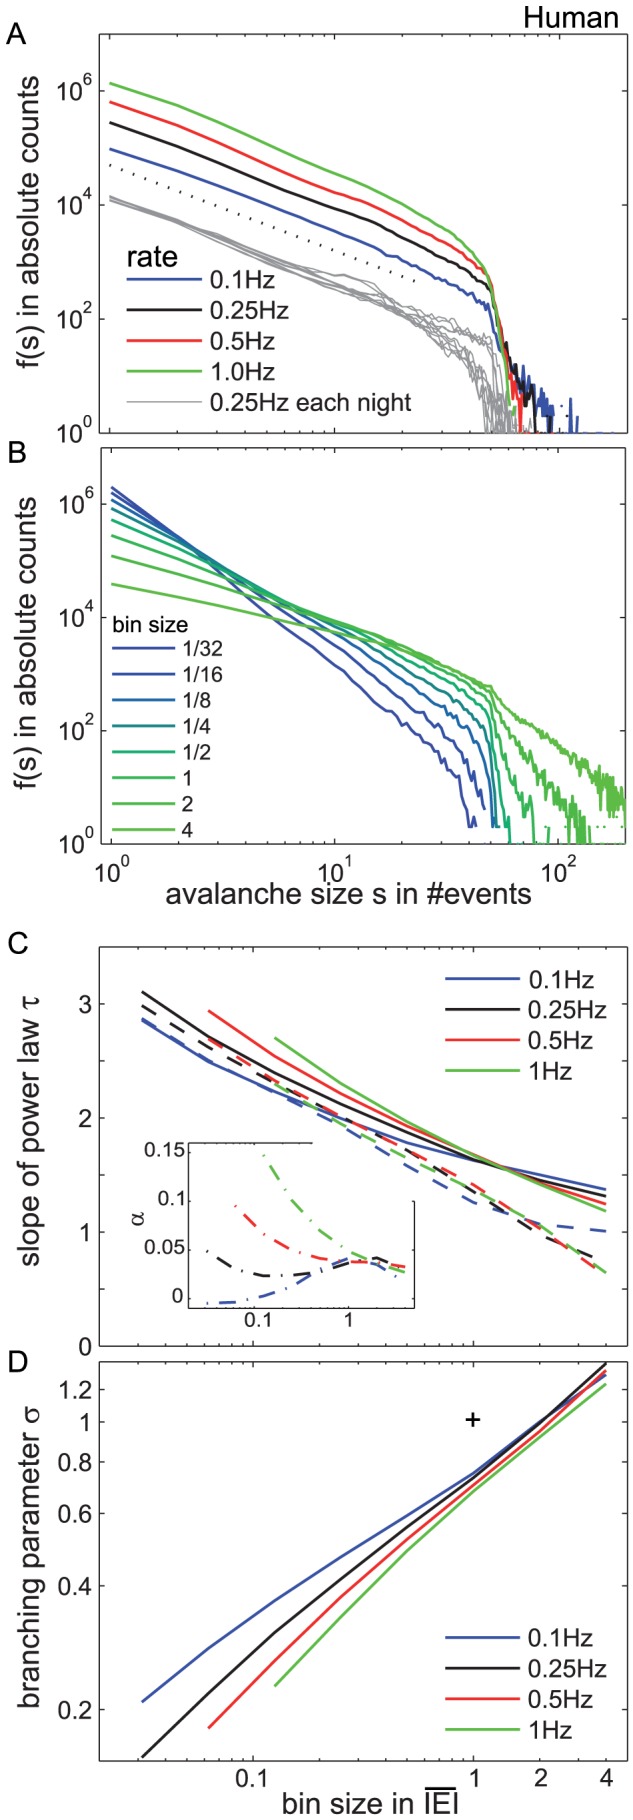
Figure 3. The neuronal avalanche size distribution f(s) for humans approximated a power law.

A. The colored line shows f(s) for all avalanches across all 10 nights, evaluated at different event rates and at bs = 1· . The gray lines show f(s) at r = ¼Hz separately for each of the nights to indicate the variability between recording nights and patients. For better visibility, the gray distributions have some offset, while the colored distributions all are in absolute counts. f(s) approximated a power law (τ = 1.5 was indicated by the dotted line). The cut off around s = 50 is known to coincide with the number of recording electrodes, 51 on average. B. The slope of f(s) changed with the temporal scale or bin sizes (bs). The bs was between 1/32
 and 4
and 4
 , while here r was fixed at r = ¼ Hz. With larger bs, the slope of f(s) became flatter, but the distributions always resembled a power law. C. The slope τ of f(s) depended on the bin size (bs), but little on the rate (colored lines). The full lines show τ from fitting a power law, while the dashed lines show τ and α for a power law with cutoff (see inset for α). τ and α for small bs at high rates are not defined, because the bs there became smaller than the time resolution from sampling (2.5 ms). Estimation errors for τ and α scale with n
−½ where n is the number of samples [24]. Here, n≈106, and thus the error is of the order 10−3, and thus error bars are close to line thickness. For details on the fitting parameters and quality, see also Supplementary Table S1 and Figure S1. D. The branching parameter σ was plotted over the bs. σ changed with the bs, but was similar across event rates (colored lines). The (+) depicts [σ = 1, bs = 1] for visual guidance.
